> ## Documentation Index
> Fetch the complete documentation index at: https://buttercms.com/docs/llms.txt
> Use this file to discover all available pages before exploring further.
# Debugging guide
> Step-by-step guide on how to debug issues with your ButterCMS integration.
## Using the API Explorer
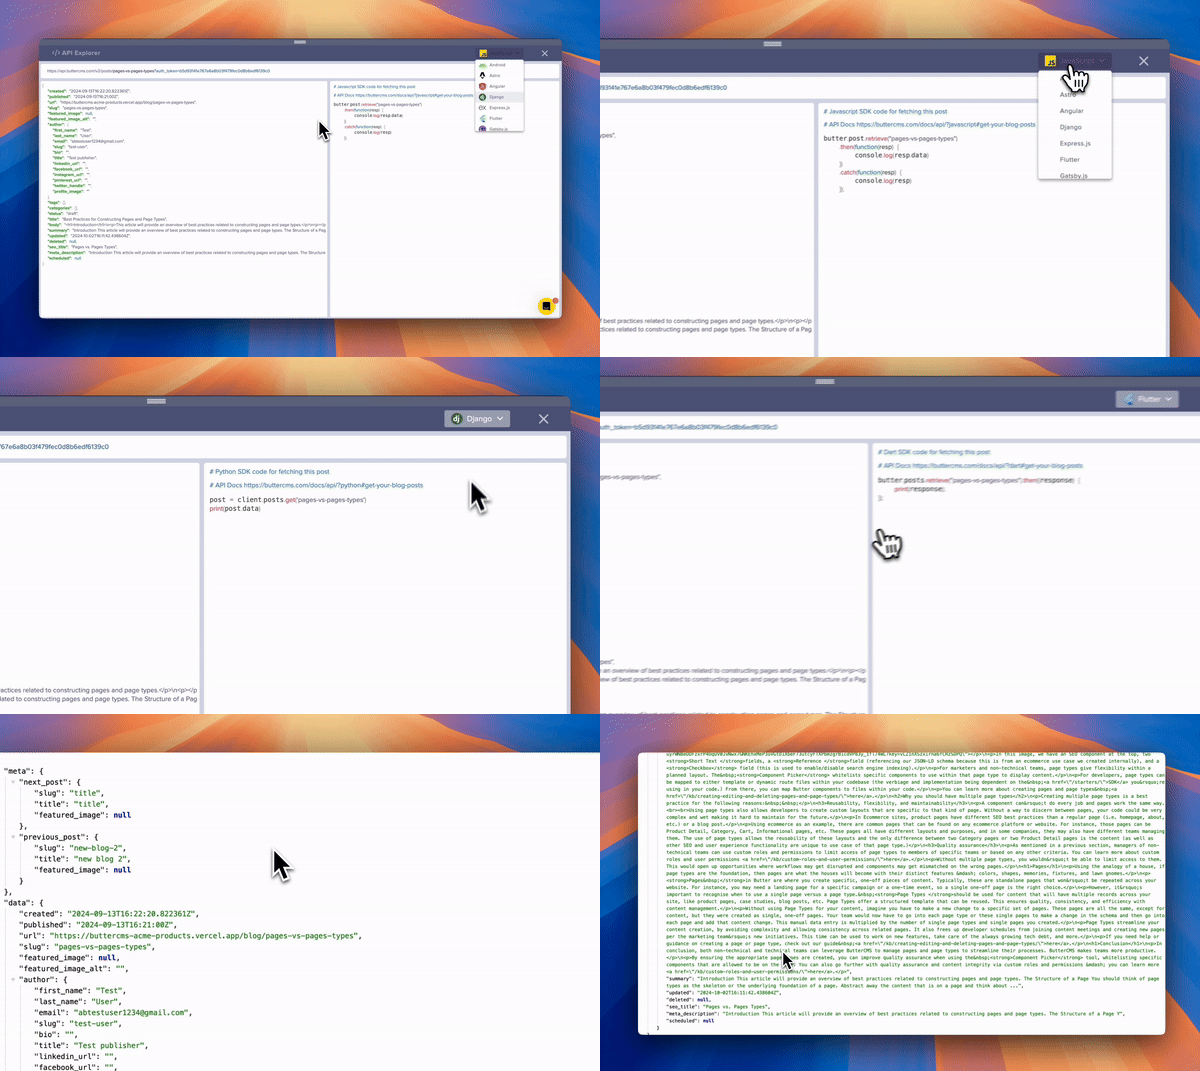
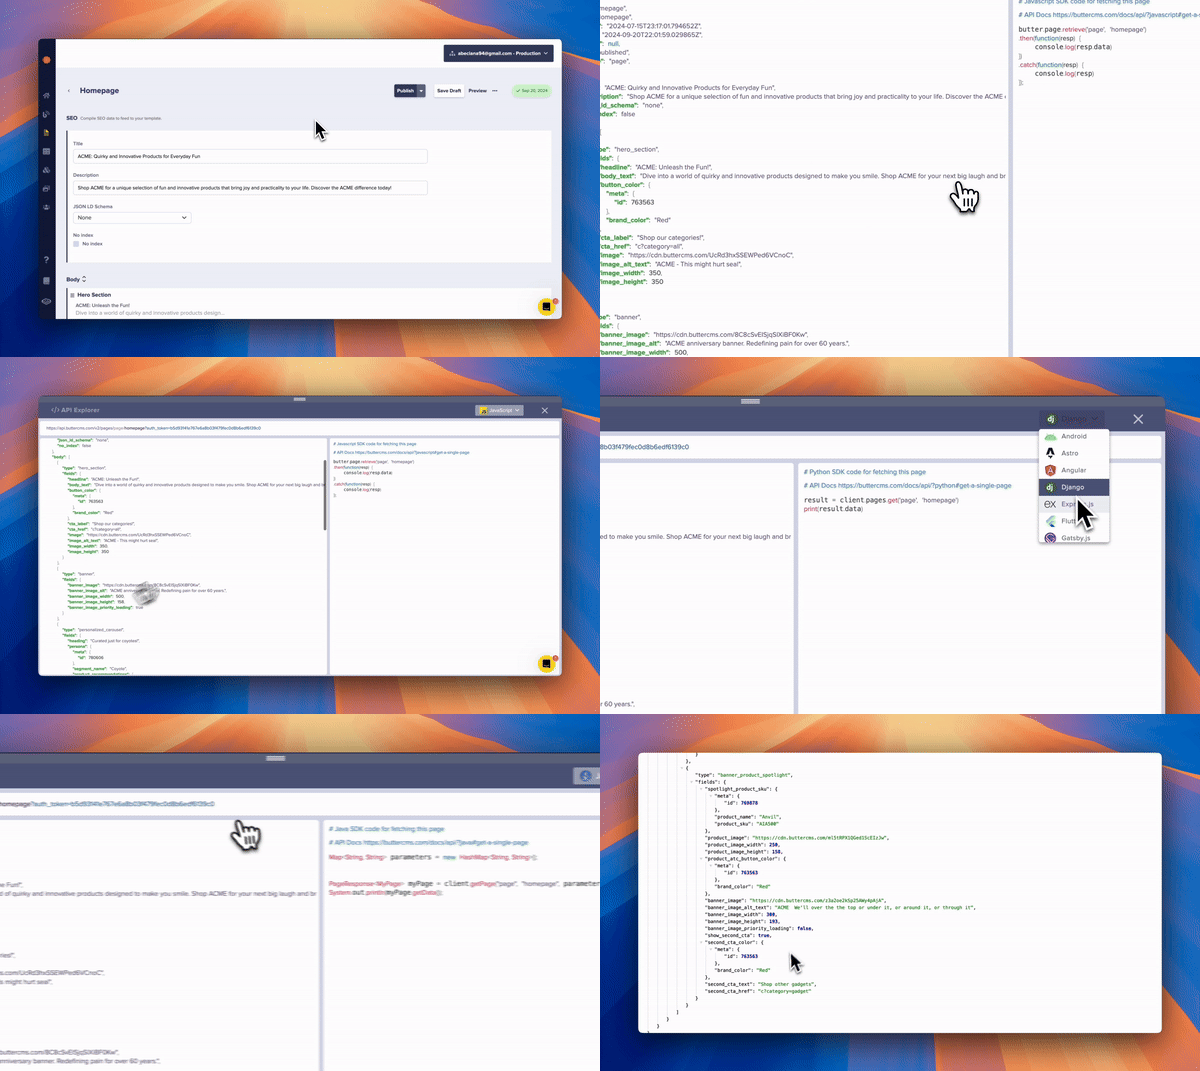
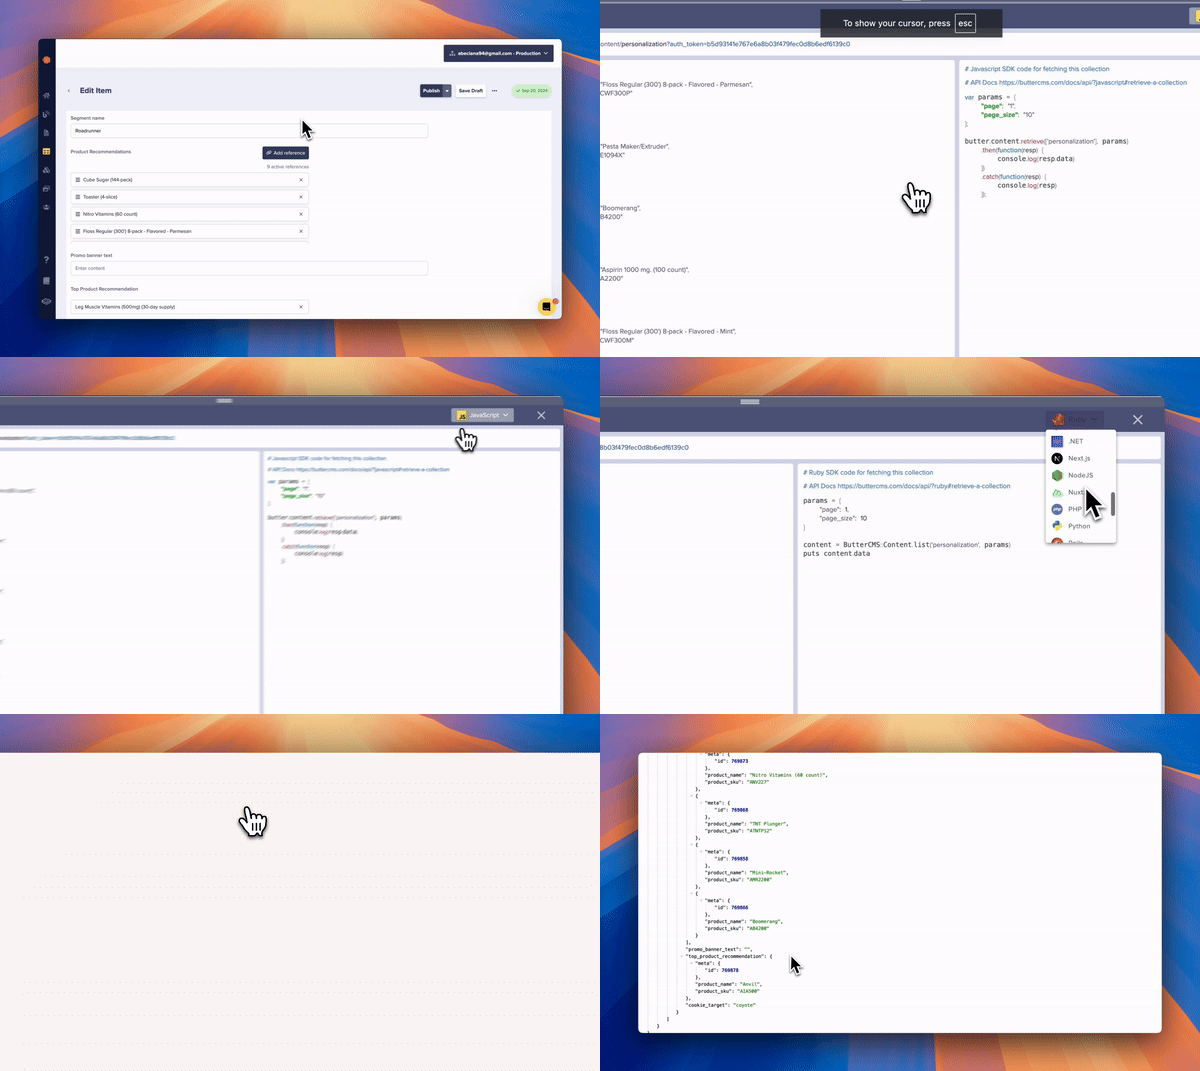
The API Explorer is your first line of defense when debugging. It allows you to:
1. **Learn how to call the API** - See exact request formats
2. **See what the response looks like** - Verify data structure before coding
3. **Access framework-specific guides** - Direct links to implementation tutorials
### Accessing the API Explorer
Navigate to any content in your dashboard and look for the **API Explorer** button:
**For Blog Posts:**
**For Pages:**
**For Collections:**
***
## Step-by-step debugging process
### Step 1: verify your API token
Before diving into complex debugging, confirm your authentication is working:
```bash theme={null}
# Test your Read API token
curl "https://api.buttercms.com/v2/posts?auth_token=YOUR_READ_TOKEN"
```
**Expected response:** JSON with your blog posts
**Error response:** `{"detail": "Authentication credentials were not provided"}`
If you get an authentication error, double-check your token in Settings > API Tokens.
### Step 2: check the network tab
Open your browser's Developer Tools (F12) and navigate to the **Network** tab:
1. Filter by "XHR" or "Fetch" requests
2. Look for requests to `api.buttercms.com`
3. Check the **Status** column for error codes
4. Click on failed requests to see:
* **Headers**: Verify Authorization header is present
* **Response**: Read the error message
* **Payload**: Confirm request body is correct (for write operations)
### Step 3: add debug logging
Add strategic console logs to trace data flow:
```javascript theme={null}
// JavaScript/Node.js example
async function fetchPage(slug) {
console.log('Fetching page with slug:', slug);
try {
const response = await butter.page.retrieve('*', slug);
console.log('API Response:', JSON.stringify(response.data, null, 2));
return response.data;
} catch (error) {
console.error('API Error:', {
message: error.message,
status: error.response?.status,
data: error.response?.data
});
throw error;
}
}
```
```javascript theme={null}
// Basic debug logging pattern
console.log("== Request sent ===");
console.log(requestData);
// Handle errors
if (err) {
console.log("There was an error: ", err);
return res.json({ error: err });
}
```
### Step 4: validate API response structure
Compare your expected data structure with the actual API response:
```javascript theme={null}
// Validate response has expected fields
function validatePageResponse(response) {
const required = ['data', 'data.fields', 'data.slug'];
for (const path of required) {
const value = path.split('.').reduce((obj, key) => obj?.[key], response);
if (value === undefined) {
console.warn(`Missing expected field: ${path}`);
console.log('Received:', JSON.stringify(response, null, 2));
}
}
}
```
***
## Common debugging scenarios
### Scenario 1: content returns empty
**Symptoms:** API call succeeds (200 OK) but data array is empty.
**Debug Checklist:**
Go to your ButterCMS dashboard and verify the content status is "Published", not "Draft".
```javascript theme={null}
// Wrong
butter.page.list('LandingPage') // Capital letters, no spaces
// Correct
butter.page.list('landing_page') // Lowercase with underscores
```
Find the correct key in Content Types settings.
If using localization, ensure the locale parameter matches:
```javascript theme={null}
butter.page.list('landing_page', { locale: 'en' })
```
Some tokens may have restricted access. Try with a new token from Settings.
### Scenario 2: unexpected data structure
**Symptoms:** Code breaks because expected fields are missing or structured differently.
**Debug Steps:**
1. **Use the API Explorer** to see the actual structure
2. **Log the full response** before accessing nested properties
3. **Check for optional fields** that might not always be present
```javascript theme={null}
// Defensive data access
const title = response?.data?.fields?.title ?? 'Default Title';
const images = response?.data?.fields?.images ?? [];
```
### Scenario 3: cached content issues
**Symptoms:** Updates made in dashboard don't appear in your application.
**Debug Steps:**
1. **Clear browser cache:** Hard refresh with Ctrl+Shift+R
2. **Check CDN cache:** CDN cache is automatically invalidated when you publish. If changes don't appear immediately, wait up to 60 seconds for global propagation
3. **Verify local caching:** If using application-level caching, clear it
4. **Use cache-busting:** Add timestamp to API calls for testing
```javascript theme={null}
// Cache-busting for debugging (remove in production)
const url = `https://api.buttercms.com/v2/pages/*/${slug}?auth_token=${token}&_=${Date.now()}`;
```
### Scenario 4: webhook not triggering code
**Symptoms:** Webhook is configured but your endpoint isn't receiving calls.
**Debug Steps:**
1. **Test endpoint accessibility:**
```bash theme={null}
curl -X POST https://your-domain.com/webhooks/butter \
-H "Content-Type: application/json" \
-d '{"test": true}'
```
2. **Use a webhook testing service:**
* Go to a url testing site, like webhook.site
* Copy the unique URL
* Temporarily set it as your webhook URL in ButterCMS
* Publish content and verify the request arrives
* After verifying webhooks are received (typically 1-2 test publishes), restore your production webhook URL
3. **Check webhook logs in your server:**
```javascript theme={null}
// Express.js webhook endpoint with logging
app.post('/webhooks/butter', (req, res) => {
console.log('Webhook received:', {
headers: req.headers,
body: req.body
});
res.status(200).send('OK');
});
```
***
## Framework-specific debugging
### React/Next.js
```javascript theme={null}
// Use React Developer Tools browser extension
// Add error boundaries for better error tracking
import { useEffect, useState } from 'react';
function useButterContent(pageType, slug) {
const [data, setData] = useState(null);
const [error, setError] = useState(null);
const [loading, setLoading] = useState(true);
useEffect(() => {
async function fetchData() {
try {
console.log(`Fetching: ${pageType}/${slug}`);
const response = await butter.page.retrieve(pageType, slug);
console.log('Response:', response);
setData(response.data);
} catch (err) {
console.error('Fetch error:', err);
setError(err);
} finally {
setLoading(false);
}
}
fetchData();
}, [pageType, slug]);
return { data, error, loading };
}
```
### Python/Django
```python theme={null}
# Enable verbose logging
import logging
logging.basicConfig(level=logging.DEBUG)
from butter_cms import ButterCMS
client = ButterCMS('your-api-token')
try:
response = client.pages.get('*', 'homepage')
print(f"Response: {response}")
except Exception as e:
print(f"Error type: {type(e).__name__}")
print(f"Error message: {e}")
```
***
## Debugging tools checklist
Use this checklist when debugging any ButterCMS integration issue.
| Tool | Purpose | How to Access |
| ---------------- | ------------------------------ | --------------------------------------------- |
| API Explorer | Verify API responses | Dashboard > Any Content > API Explorer button |
| Browser DevTools | Network requests, console logs | F12 or Right-click > Inspect |
| Postman/Insomnia | Test API calls in isolation | Download from website |
| webhook.site | Test webhook delivery | [webhook.site](https://webhook.site) |
| Console logging | Trace code execution | Add to your application code |
***
## When to contact support
If you've tried the above steps and still can't resolve the issue, [contact support](../contact-status/contact-support) with:
1. **Your account email**
2. **The specific endpoint/content causing issues**
3. **Error messages** (full text, not screenshots)
4. **Steps to reproduce** the issue
5. **What you've already tried**
Reach our support team
Reference all error codes