Get real-time insights with ButterCMS Analytics
What you can do with Analytics
The dashboard provides a centralized view of your CMS activity, helping you understand usage patterns, monitor API traffic, and support capacity planning.
The dashboard includes key usage metrics, including:
-
Users
-
Pages
-
Blog Posts
-
Collections
-
Read API Requests
-
Write API Requests
Each metric supports:
-
Line, Area, and Bar chart views
-
Running Total toggle for cumulative trends
Filtering and customizing your view
Use filters to narrow or expand exactly what you want to see:
-
Site: View a specific site or opt-in to view all sites
-
Environments: Development, staging, and production
-
Date Range:
-
Month to Date
-
Previous Month
-
Last 12 Months
-
Custom Range
-
-
Aggregation: Daily, Weekly, Monthly, or Yearly
These filters help you explore both high-level patterns and narrow operational issues.
Exporting your data
You can export your filtered dashboard results as a CSV file for reporting or further analysis. Exports include:
-
Site and Environment
-
All visible KPI metrics
-
Data grouped by the selected aggregation (daily / weekly / monthly / yearly)
This makes it easy to integrate Butter usage data into your existing analytics workflows and stack.
Accessing the Analytics dashboard
To access the dashboard, click here or:
-
Log in to ButterCMS.
-
Select Analytics on the navigation menu.
-
Your real-time charts and filters will appear immediately.
No configuration or additional permissions are required.
Click Analytics from the navigation bar

Sample usage, blog posts, and collections metrics

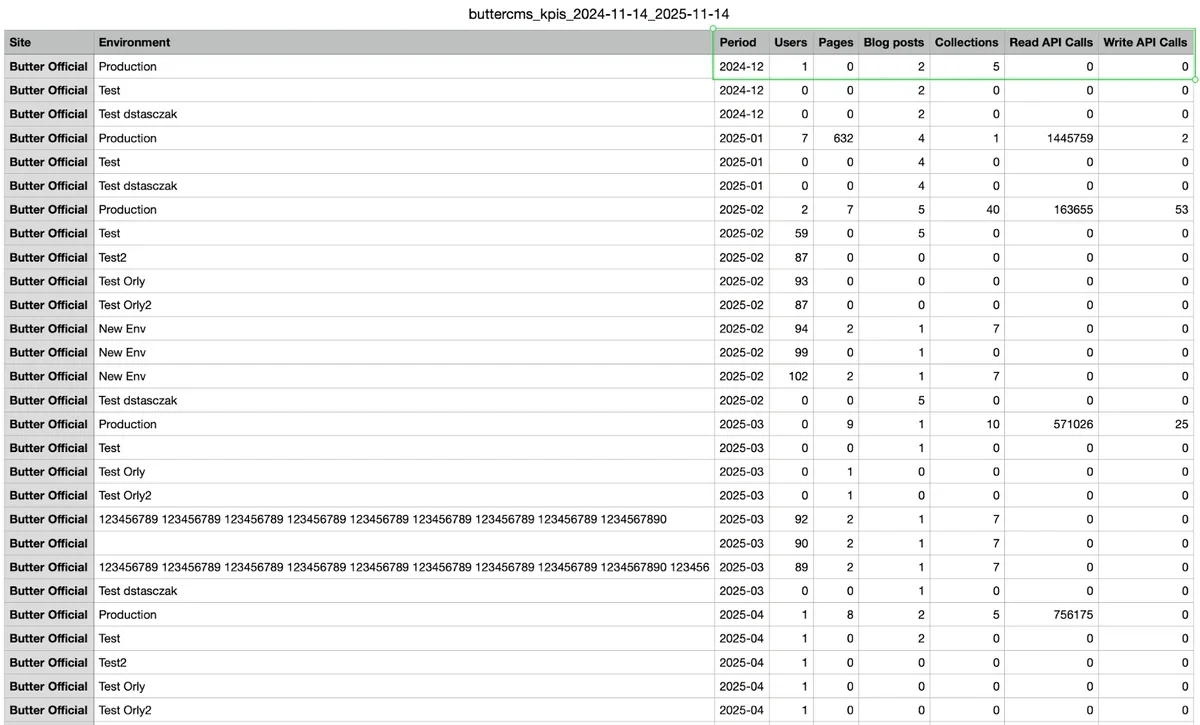
Sample cvs export
Who this helps
For developers and technical leads
Get instant visibility into API activity, content volume, and environment-specific usage. Quickly identify spikes, monitor deployment hygiene, and export data for system monitoring tools.
For marketers and content teams
See how your content is growing over time. Track pages, posts, and collections to plan launches, support campaigns, and manage day-to-day content operations, all with simple, self-serve analytics.
For partners and agencies
Review API traffic and content activity across client projects in one place, share real-time insights with clients, and ensure environments stay healthy throughout development and as they evolve.
Summary
The Analytics dashboard gives your team a clear, real-time picture of your ButterCMS usage. It spans content activity, user activity, API traffic, and, when applicable, your sites and environments.
It’s fast, simple, and built directly into the ButterCMS app so you can stay informed without switching tools.