Table of contents
What is front-end performance?
Today’s web can be accessed via a multitude of devices, of all shapes and sizes, on network speeds ranging from 2G 0.3mbps all the way to 5G 10gbps. With such a wide variety of internet users out there, how fast a website loads is more important than ever.
This first part of a two-part series will introduce you to the world of front-end performance optimization. We’ll discover why front-end performance matters, how to measure your web application performance, and what tools you should use to collect these relevant metrics.

Get comfortable, grab a cup of tea and let’s get started!
Why front-end performance matters
Good web performance is an essential ingredient for any website serious about achieving its goals.
Front-end performance has a significant influence on the following key factors:

- Retaining website visitors
- Improving conversion
- Increasing organic traffic
- Saving users money
Retaining visitors to the website
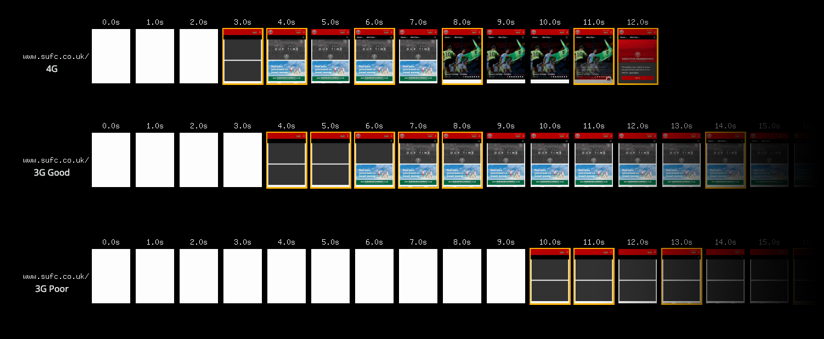
If a user were to visit a website and it’s loading slowly, they’re likely to grow frustrated because they aren’t able to do what they came to do. This problem can be compounded by the user’s connection speeds. (Find out which old browsers your users are still using are worth supporting)
On a blog, users need to be able to read the posts. On an e-commerce website, users need to be able to browse and buy things. If a user isn’t able to engage with the website, rather than pressing ahead, it’s more likely they’ll just go elsewhere.
In these real case studies, can you guess the impact good performance (or lack of) has on user experience?
<script type="text/javascript">var app_5d41ccb57e25640014ddd95a;(function(d, t){var s=d.createElement(t),options={"appId":"5d41ccb57e25640014ddd95a","width":"800","height":"800","async":true,"host":"quiz.tryinteract.com","no_cover":true,"footer":"show"};s.src='https://i.tryinteract.com/embed/app.js';s.onload=s.onreadystatechange=function(){var rs=this.readyState;if(rs)if(rs!='complete')if(rs!='loaded')return;try{app_5d41ccb57e25640014ddd95a=new InteractApp();app_5d41ccb57e25640014ddd95a.initialize(options);app_5d41ccb57e25640014ddd95a.display();}catch(e){}};var scr=d.getElementsByTagName(t)[0],par=scr.parentNode;par.insertBefore(s,scr);})(document,'script');
Improving conversions
When a business builds a website, its goal is ultimately to generate revenue by converting website visitors into paying customers. The success of this can be helped by good web performance, and equally hindered by poor web performance. If pages are slow to load, it’s going to impact the users' shopping experience and increase the likelihood of them going elsewhere.
Here are a few more case studies. Can you guess what impact web performance has on conversion metrics?
Increasing organic traffic
In 2010, Google announced site speed was now a factor in how their algorithm ranks websites on desktop searches. Later, in July 2018, a further speed update was released which extended this behavior to mobile searches as part of their mobile-first indexing project.
Essentially, this means a slow loading website can hurt your organic search rankings on Google. By focusing on improving your site speed, you’re not only improving the user experience but helping them to discover your website in the first place. A win-win, and something we know works, as you’ll see in the case studies below:
Saving users money
Lots of users across the globe are still accessing the web via pay as you go sim plans, so the larger a website, the more it will cost them per visit.
<script type="text/javascript">var app_5d41fc0b7e25640014ddda54;(function(d, t){var s=d.createElement(t),options={"appId":"5d41fc0b7e25640014ddda54","width":"800","height":"800","async":true,"host":"quiz.tryinteract.com","no_cover":true,"footer":"show"};s.src='https://i.tryinteract.com/embed/app.js';s.onload=s.onreadystatechange=function(){var rs=this.readyState;if(rs)if(rs!='complete')if(rs!='loaded')return;try{app_5d41fc0b7e25640014ddda54=new InteractApp();app_5d41fc0b7e25640014ddda54.initialize(options);app_5d41fc0b7e25640014ddda54.display();}catch(e){}};var scr=d.getElementsByTagName(t)[0],par=scr.parentNode;par.insertBefore(s,scr);})(document,'script');
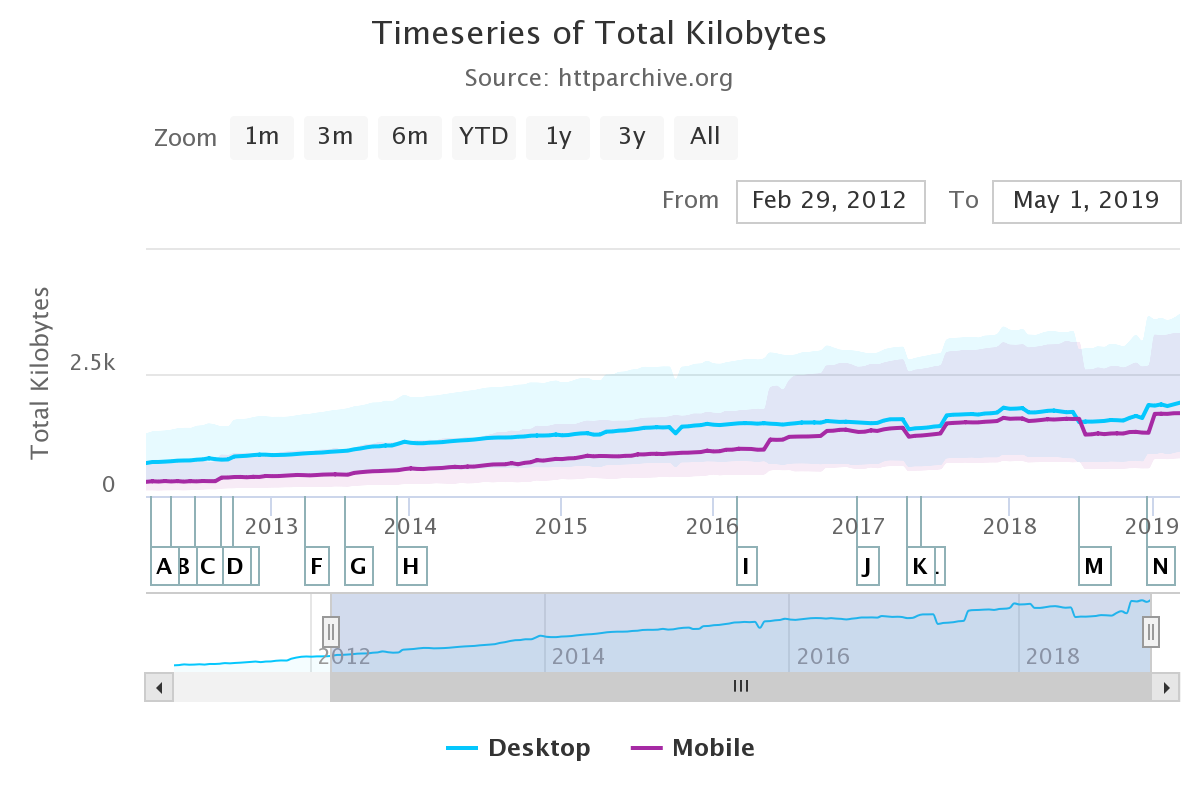
The median size of websites has been steadily increasing year on year, with the current median page size (in megabytes) being as follows:
|
Page Size (In megabytes) - May 2019 |
|
|
Median Desktop |
Median Mobile |
|
1.9mb |
1.7mb |
|
75th Percentile Desktop |
75th Percentile Mobile |
|
3.7mb |
3.3mb |
Did you know, the original DOOM is only 2340kb (or 2.3mb)? This puts the growing size of websites into perspective.
Let’s compare some of today’s popular websites against this classic video game. Here’s some appropriate music for the next section.
<iframe
DOOM vs The Guardian

DOOM vs MailOnline

DOOM vs CNN

DOOM vs DOOM’s website

Thanks to the handy tool at whatdoesmysitecost.com, we can estimate how much this will cost. As per the website:-
“Prices were collected from the operator with the largest market share in the country, using the least expensive plan with a (minimum) data allowance of 500 MB over (a minimum of) 30 days. Prices include taxes. Because these numbers are based on the least expensive plan, they are best case scenarios.”
Using this data, we can estimate how much it would cost to visit CNN’s homepage on “pay as you go” plans:
|
CNN.com Website Cost (Top 5) |
|
|
Country |
Cost ($USD) |
|
Canada 🇨🇦 |
$1.45 |
|
Japan 🇯🇵 |
$1.01 |
|
Brazil 🇧🇷 |
$0.99 |
|
Germany 🇩🇪 |
$0.94 |
|
United States 🇺🇸 |
$0.75 |
|
United Kingdom 🇬🇧 |
$0.19 |
Source: https://whatdoesmysitecost.com/test/190623_CQ_fd39240f3e59f96708d2a158fc5580b6
Clearly, front-end performance can have a significant impact on your profitability and customer satisfaction. To improve front-end performance, and by extension, these important measures, understanding how to first measure front-end performance using appropriate metrics is a must.
Measuring Front-End Performance
How do you measure good front-end performance as a developer? What are the most common metrics in use? What front-end performance optimization tools should you use? What are the best front-end performance optimization techniques to learn? Let’s find out!
Common Performance Metrics
These are metrics which many of the top web performance tools (more on these later) use to gauge how fast a website loads.
Time to First Byte
This metric is used to measure the responsiveness of a web server. So when you visit a website, how long does it take the webserver to respond to requests made by the browser. Bad server config or poor back-end coding would be responsible for poor performance in this metric, rather than front-end code. (Have you considered going serverless to enjoy the benefits?)
First Contentful Paint
First contentful paint is a metric measuring from typing in the URL and keying enter to the point where the browser starts to render the first bit of visible content. Think of it as the time spent on the blank, white loading screen before the website loads the first bit of content.
First Meaningful Paint
This is another paint-oriented metric that measures how long it takes a browser to render the majority of above the fold content, including any web font dependencies (Google fonts, Typekit, etc) the website has. Think of this as how long it takes the browser to load something recognizable and expected.
Speed Index
Speed index measures generally how long it takes for all of the pages content to become visible during load. The lower the speed index metric, the better the website’s performance. Specifically its perceived loading time.
First CPU Idle
This metric measures when a web page becomes minimally interactive, in that users can begin to use some - but not all - on page UI components and have them respond to input and actions in a reasonable amount of time.
Time to Interactive
This is very similar to the First CPU Idle metric but requires a more complete level of page interactively. For this to trigger, a page must display the majority of its useful content and register most of the page’s event listeners. In addition, any user input or actions must be responded to within 50 milliseconds.
Estimated Input Latency
Estimated Input Latency measures how long your website takes when responding to any user input. It’s measured in milliseconds and during the most intensive 5s of page load. If this latency figure is over 50 milliseconds, this may result in laggy interactions for the user.
Last Painted Hero
This metric tracks how long it takes for the more important elements of the page to render. In a typical page layout, not all elements are created equal because as designers, we want to guide the user down a certain journey. Depending on the tool, this may be triggered when the biggest image is rendered, or the headline text in a <h1> for example.
Document Complete
Document complete tracks the time it takes for the browser’s onLoad event to fire, which happens when all static assets, such as images, CSS, JavaScript have loaded. This is a useful metric to get an overview of how fast a website is loading.
Fully Loaded
This isn’t too dissimilar from the document complete event, except that it factors in any asynchronous activity which occurs (via 3rd party scripts) after the browser’s onLoad event has come and gone. Typically a measurement is finally captured when network activity has ceased for around 2 seconds.
This is useful because it allows you to get an idea of the impact 3rd party scripts are having on a website’s loading, which is something the Document Complete metric typically wouldn’t cover.
The Best Free Front-End Performance Tools
There’s plenty of front-end performance tools out there - free and subscription-based - which allow you to audit the performance of your website and collect metrics covered in the previous section. However, these 2 stand above the rest. They are Google Lighthouse and WebPageTest.
Google Lighthouse
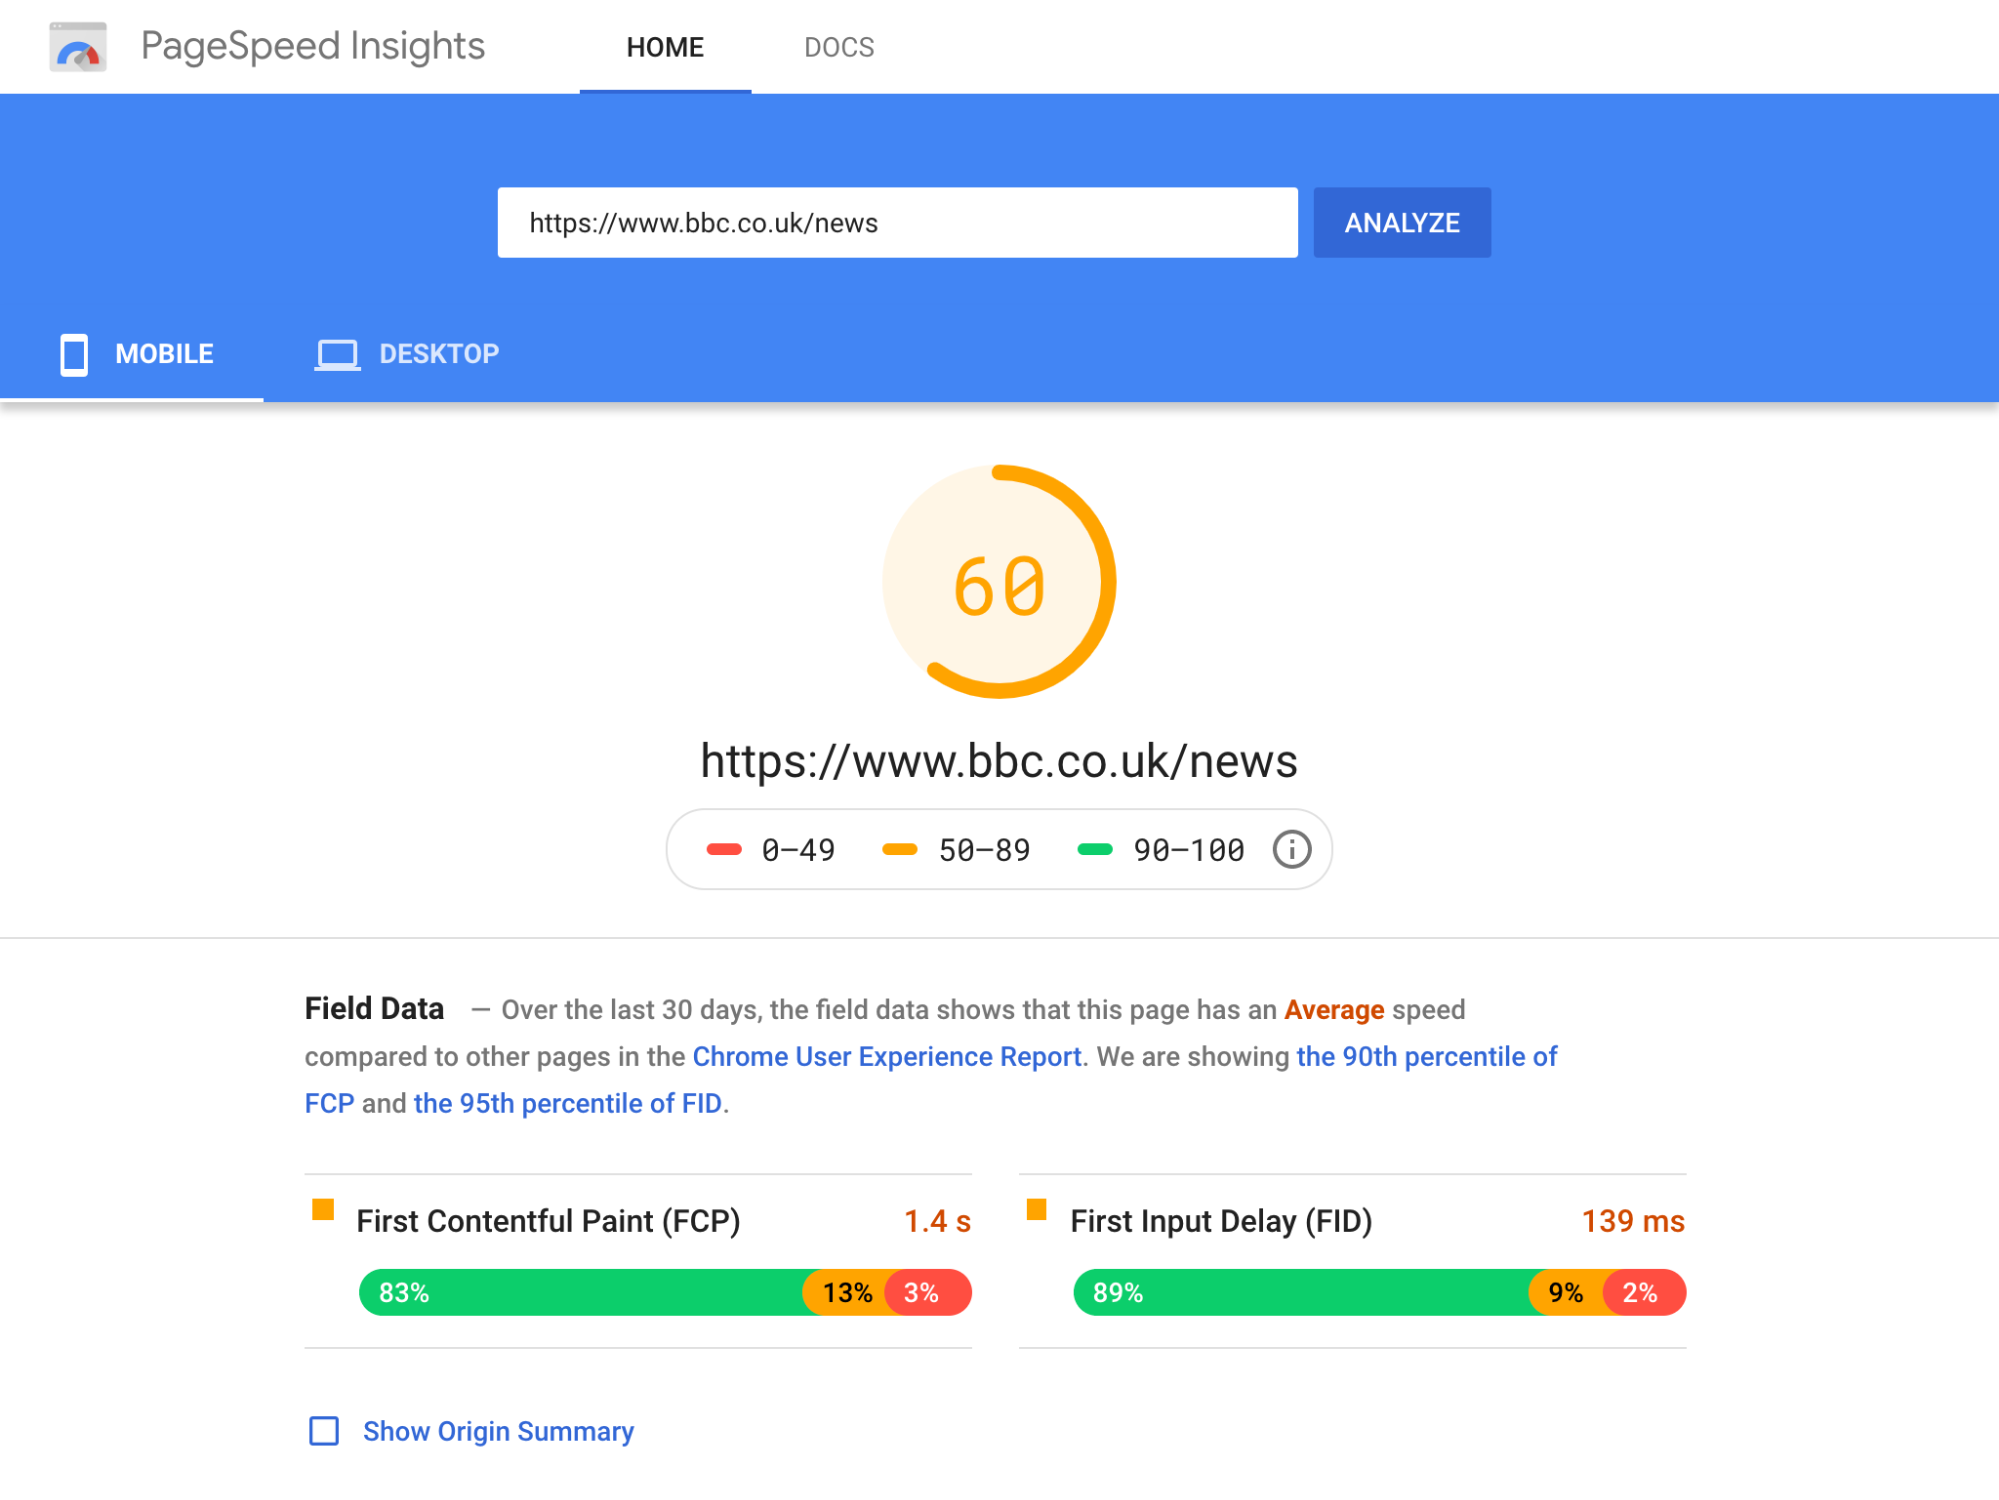
Google Lighthouse is a tool for running performance audits of a website. It generates an easy to read report featuring data for many of the metrics covered previously, as well as a list of suggestions for improving them.
One of it’s most useful features is the scoring system it applies to your website’s performance and other metrics, based on a 0-100 scale. This makes it easier for devs to communicate performance learnings with non-technical project stakeholders, as there’s no prerequisite knowledge required - just the ability to recognize that the higher the performance number, the better.
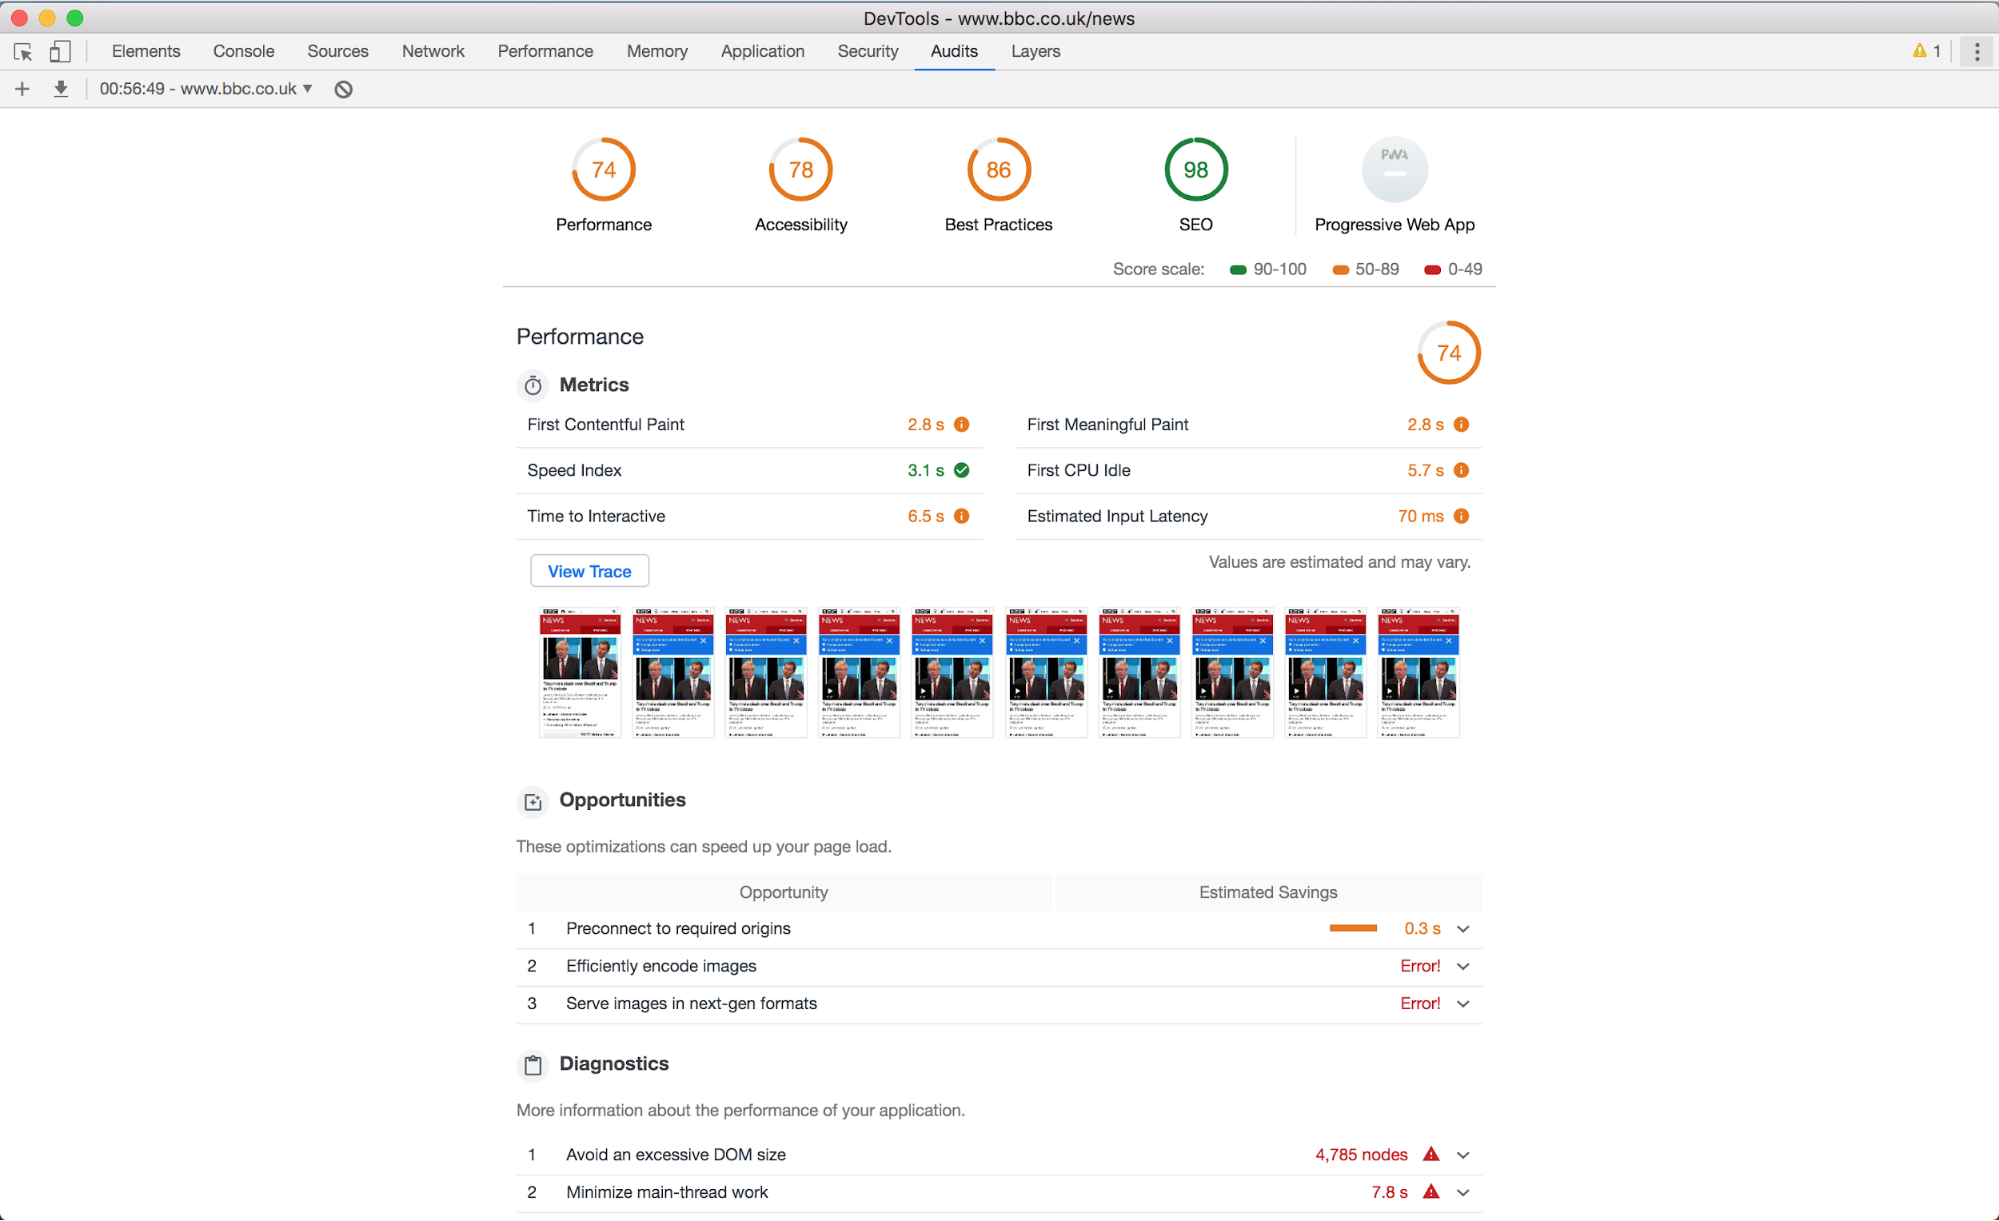
Lighthouse can be run straight from Dev Tools (Above), via the web (via Pagespeed Insights), via the terminal or programmatically as a NodeJS module (Docs).
Pros of Lighthouse
- Lighthouse has a shallow learning curve as it’s designed with simplicity in mind. It’s very much the perfect gateway into the world of web performance auditing.
- Useful for generating sharable reports with stakeholders and other non-technical folks.
- Lots of different options for using Lighthouse via the browser, the web, terminal or via Node. This flexibility means it can slot into any workflow.
- Because Google is often at the forefront of web performance, you can have confidence that any recommendations for improvement covered in the audit are up to date and technically sound.
Cons of Lighthouse
- If running online via PageSpeed insights, test results don’t persist, so it’s your responsibility to save the findings via exporting them manually or using another service which saves them for you.
- Not necessarily a con, but when doing regular Lighthouse tests to track performance over time, it’s better to run them from PageSpeed Insights, as this guarantees that tests will always run using the same baseline environment. If you were running these locally via DevTools, a test run using the latest MacBook Pro VS an older Windows laptop may yield different metrics, as these are reliant on what local system resources are available.
- It’s unclear where the tests are being run from. They may be run locally, or they may be run from the other side of the world. It’s useful to know because, in order to emulate a true customer experience, you need to run tests from similar geographical regions in order to simulate connection speeds, etc.
WebpageTest
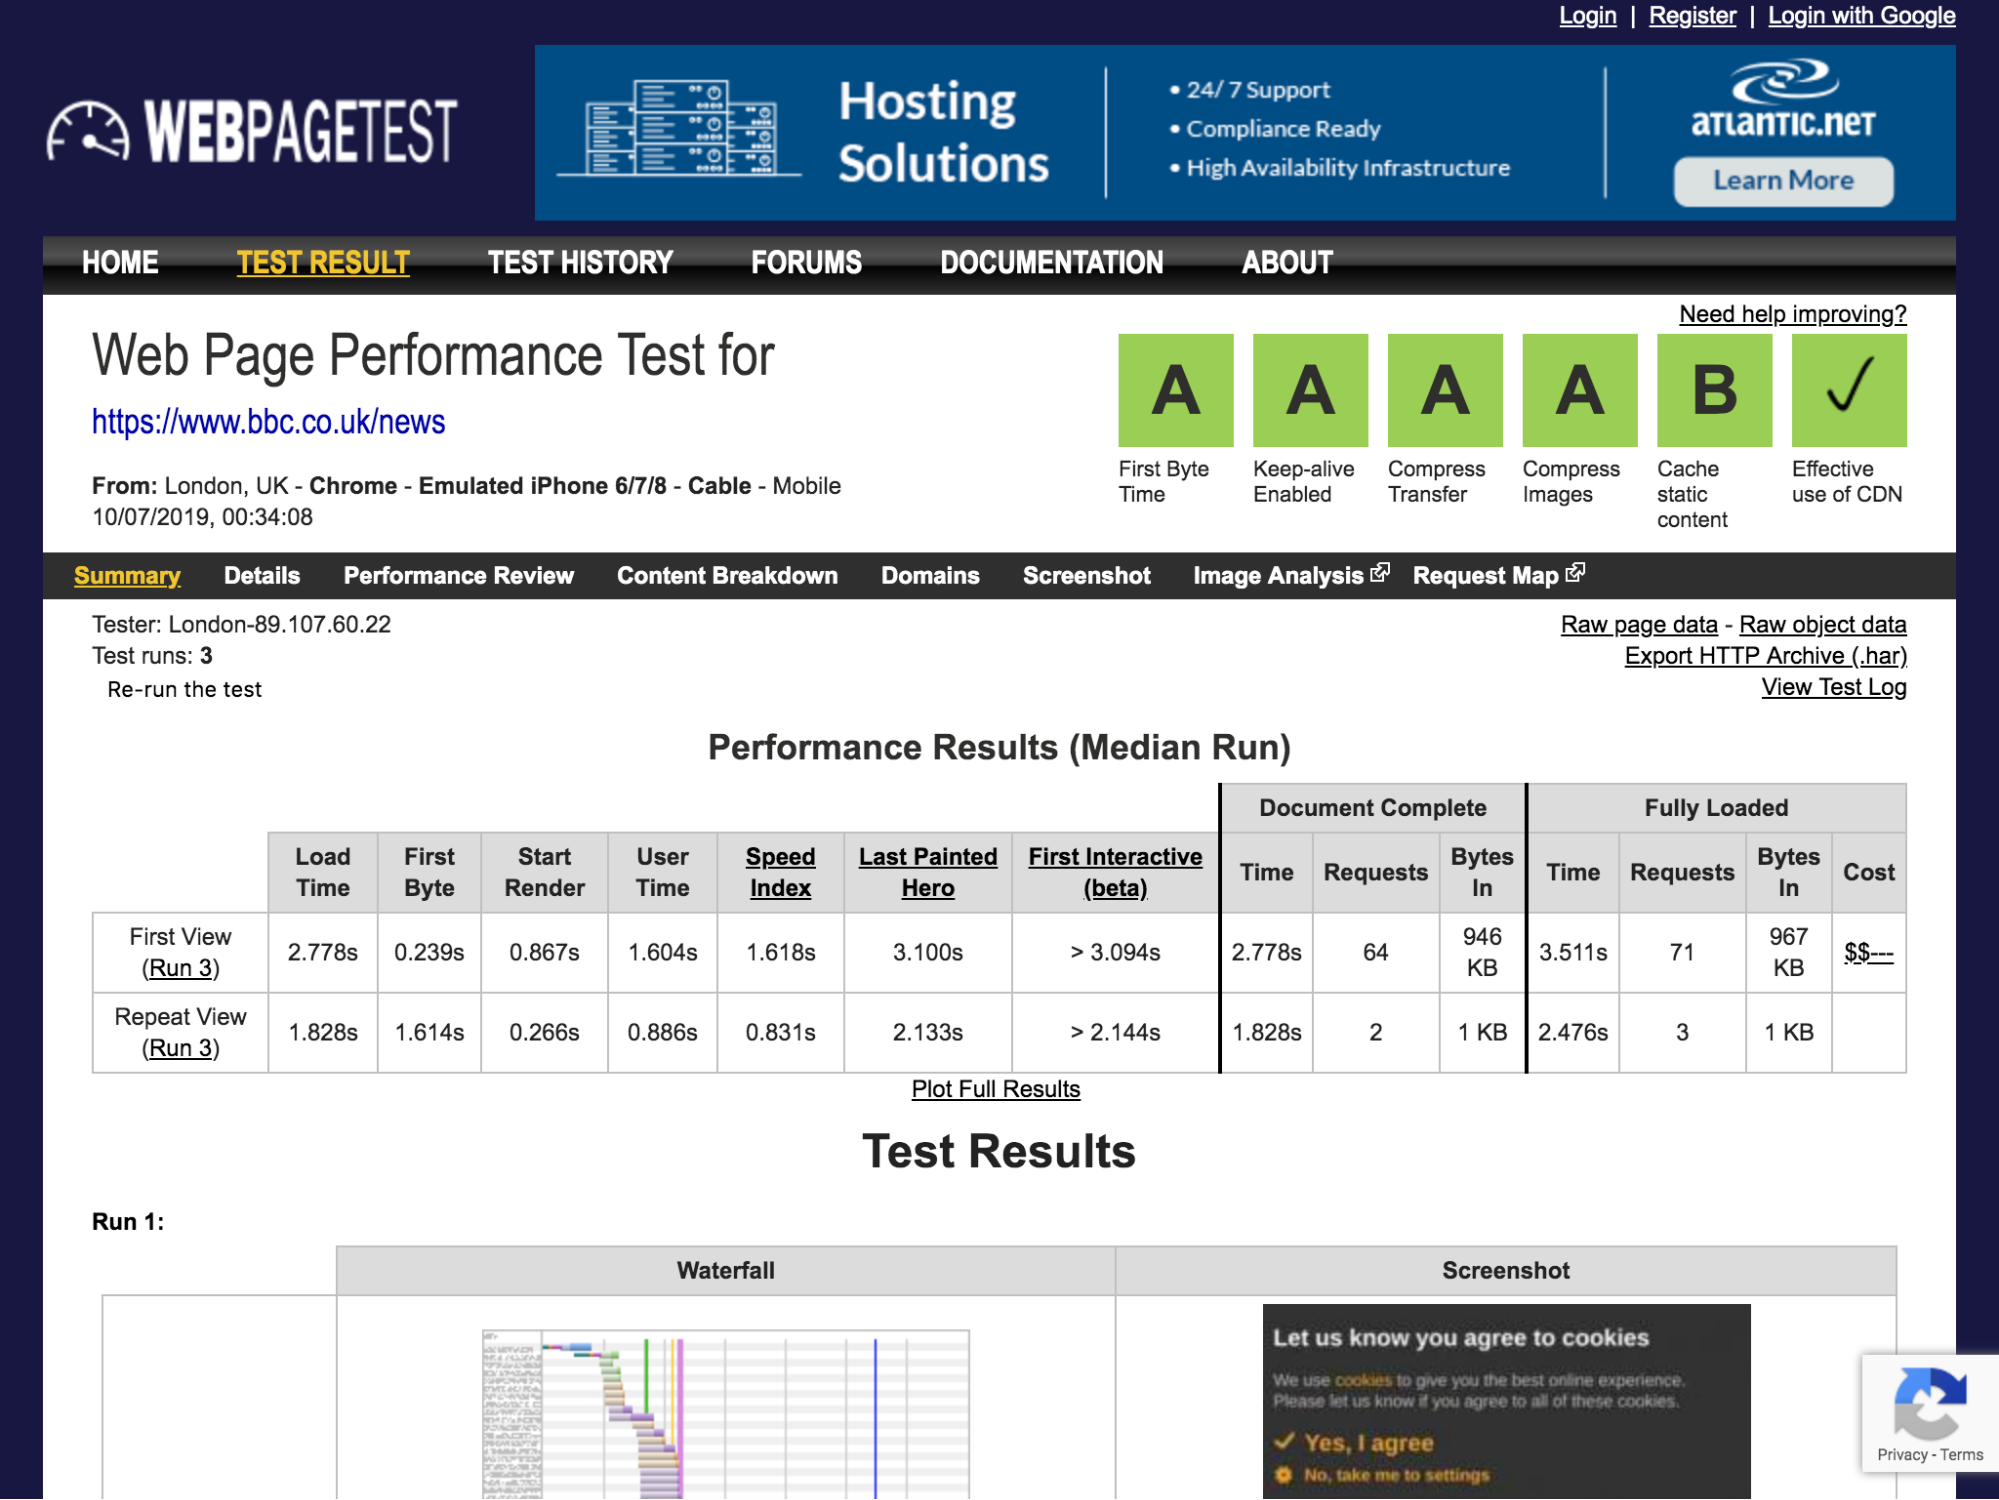
Whilst Google Lighthouse is great for generating performance audits that are digestible by less-technical users such as stakeholders and marketers, Webpagetest is geared exclusively towards the web performance engineers themselves.
It captures a huge amount of data per test, from individual metric timings, recordings of the webpage loading, timelines showing the page’s requests, to even Google Lighthouse reports.
Webpagetest Tips & Tricks
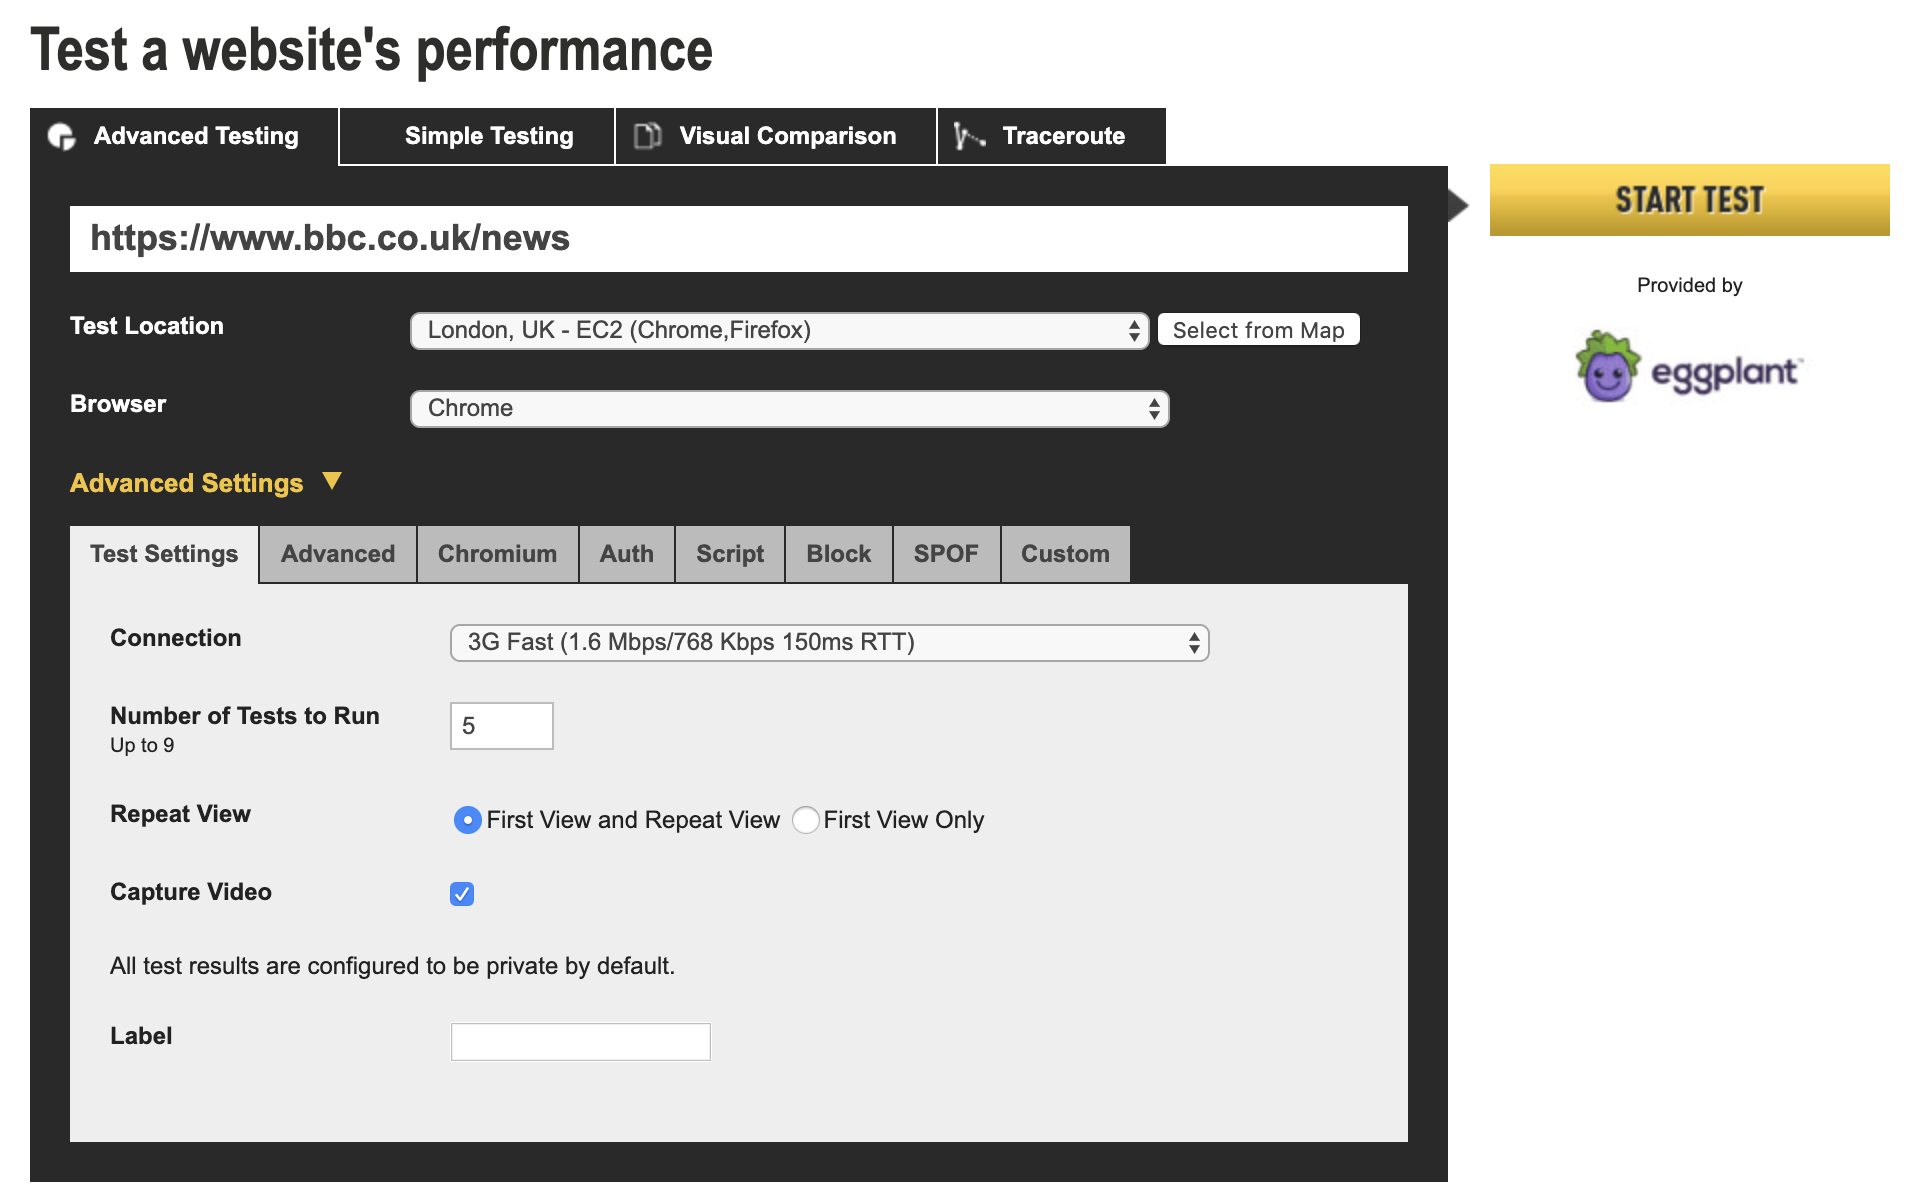
Metric Medians
Set “Number of tests to run” to 5, as this gives you a set of medians for metrics, avoiding data misrepresentation if one test happens to run when your server is having a bit of a hiccup.
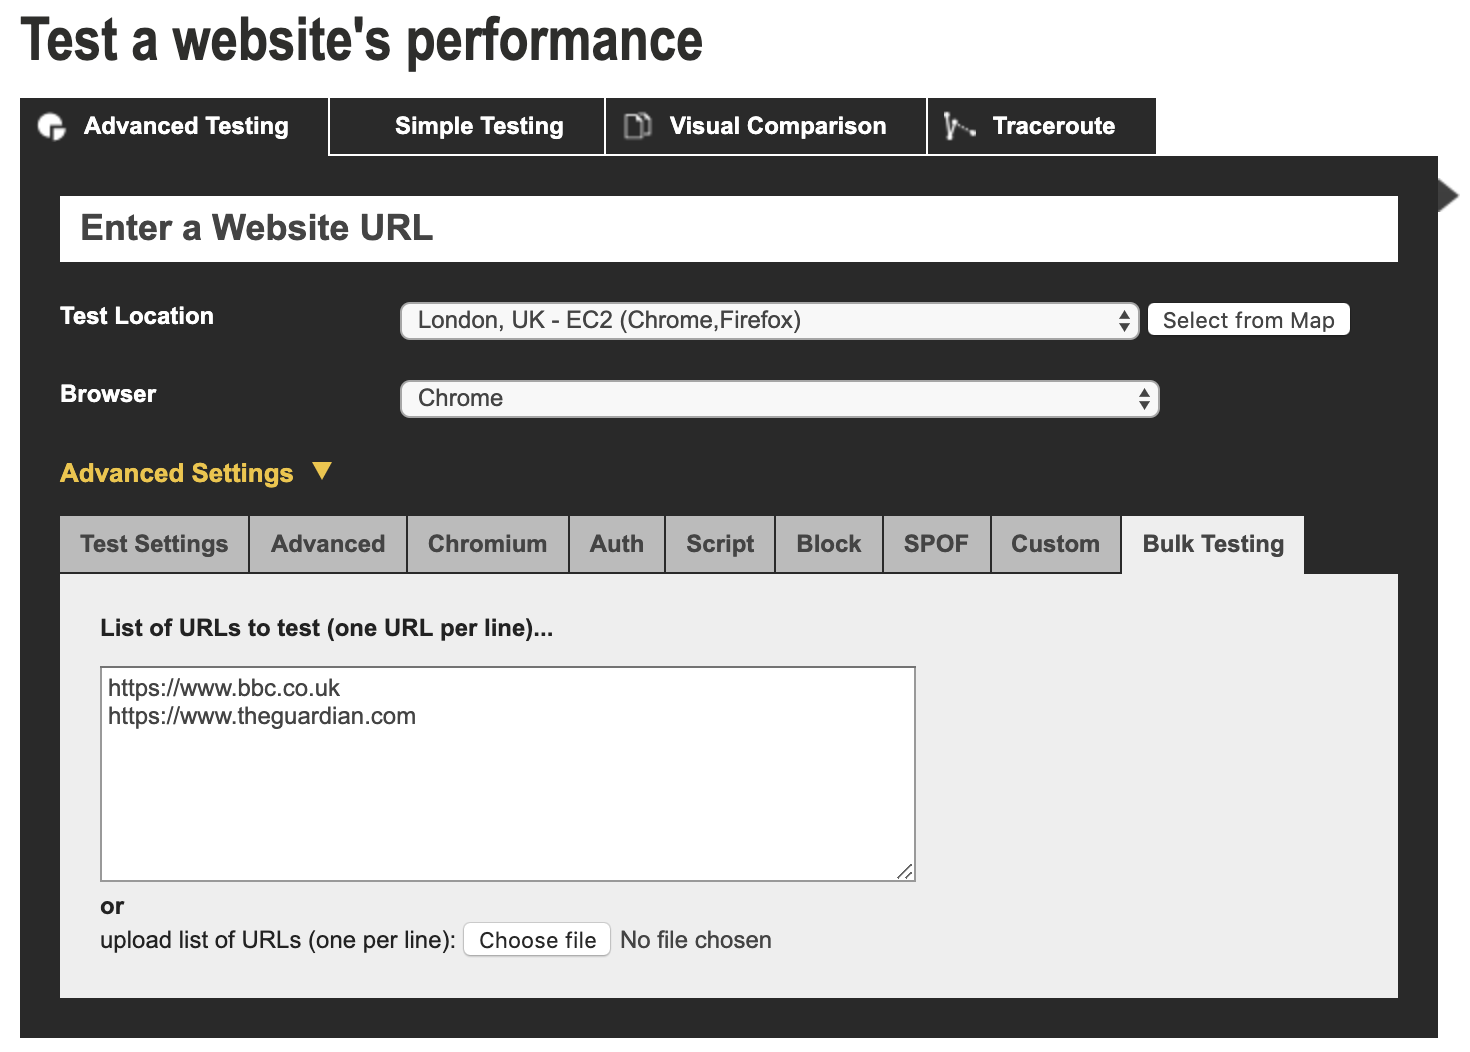
Bulk Testing
Adding a ?bulk=1 to the URL like https://www.webpagetest.org/?bulk=1 enables an extra tab option called “Bulk Testing”. Here, you can automate the testing of multiple URLs, one after the other.
Repeat View
When running tests, always select “First View and Repeat View”. The first view simulates how the website performs when a user is visiting it for the first time, whilst repeat view tests just that. The reason we test repeat views is that this gives insight and metrics around how your website’s caching and service worker strategies are performing.
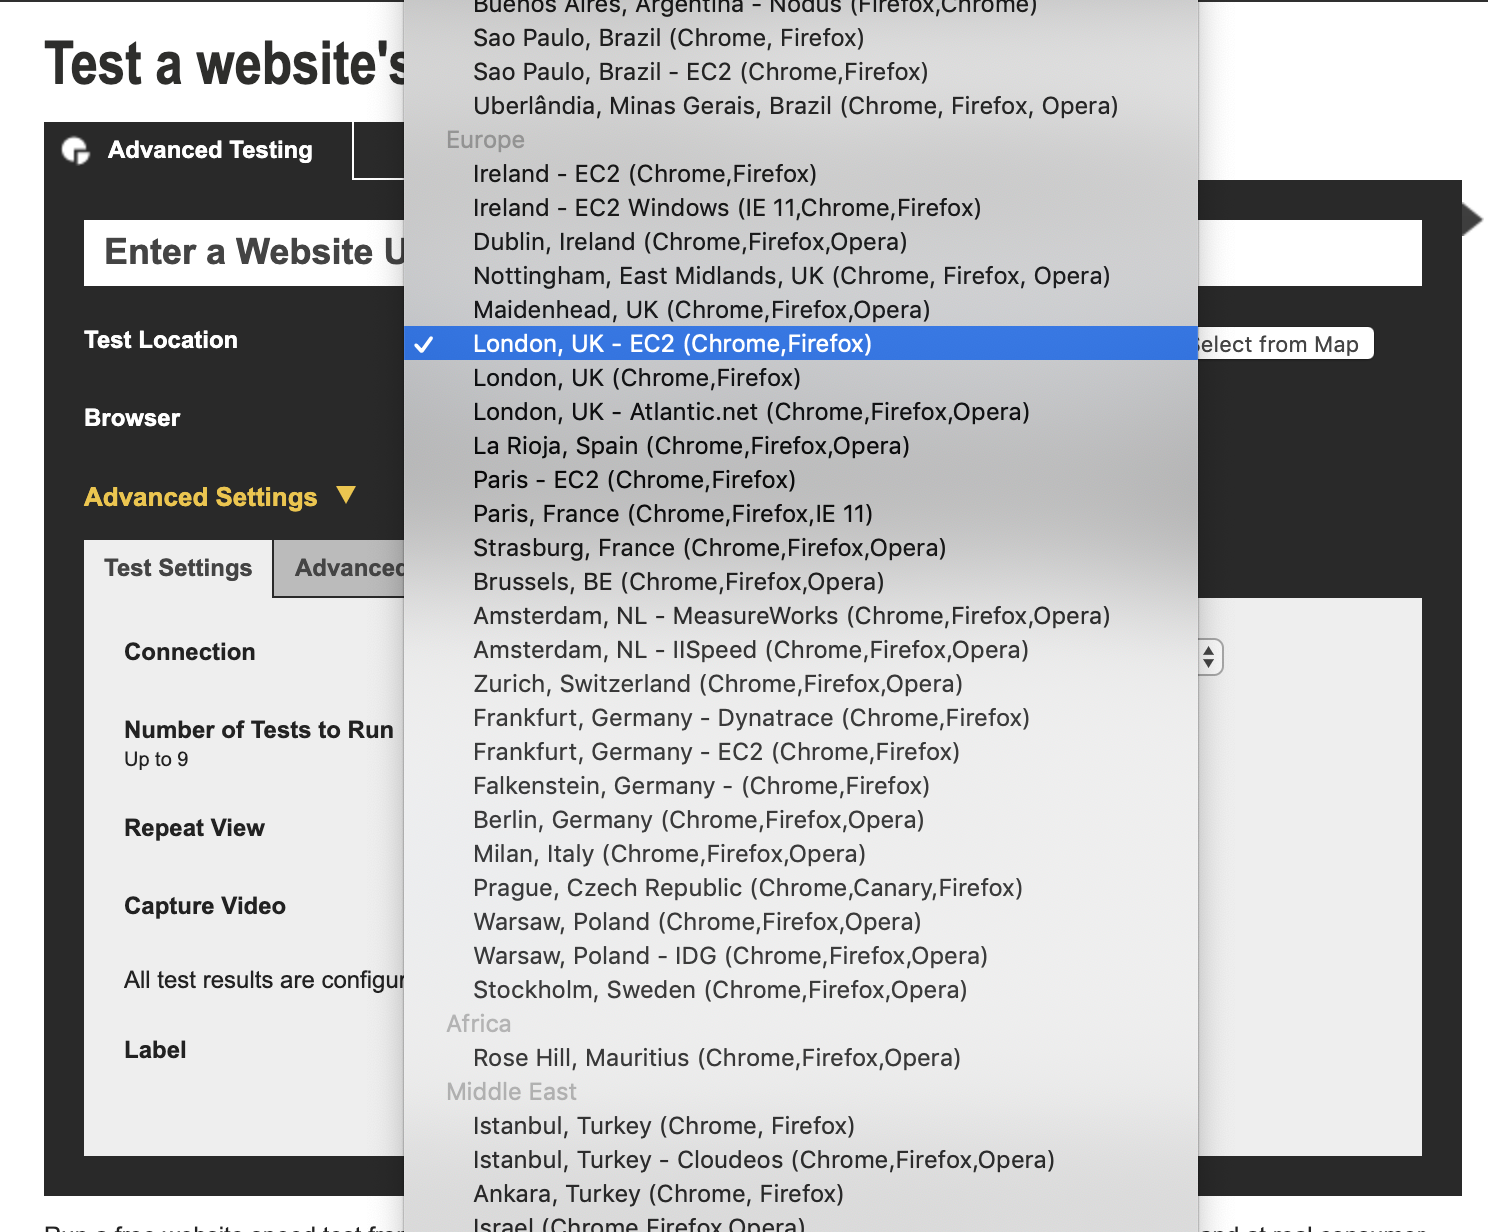
Test from an appropriate location
When running tests, always select a server location that is relevant to the customer base your targeting. For example, if you’re a UK based company with a customer base there, you’re not getting an accurate report of how those users are experiencing your website if you’re running a test using a server in sunny California.
Pros of Webpagetest
- When you run a test, the results are saved forever. This means you can share the URL with the confidence that anybody will be able to view it at any time.
- It’s all free, so you don’t have to pay to unlock new features. Everything is available and it’s glorious.
- There’s no rate limiting when you register, so you can run as many tests as you need without a mandatory timeout.
Cons of Webpagetest
- Because Webpagetest is so popular, sometimes a queue of tests can form which can get pretty long. In this instance, you either go and make a cup of tea ☕️ and wait it out or test from a different, less popular server.
- Webpagetest has a steep learning curve, so don’t be surprised at first if you’re a little overwhelmed with the huge volume of data you’re presented with once the test is complete. Practice makes perfect, and if not, there’s a good book to help you along the way.
Final Thoughts
This article should help you understand why it’s important to spend project time on improving the front-end performance of a website.
Now you know how to measure and understand a website’s current performance, in the upcoming part 2 of this series, I’m going to follow up with a breakdown of some of the recommended front-end performance optimization techniques you can use to improve it. Stay tuned!