
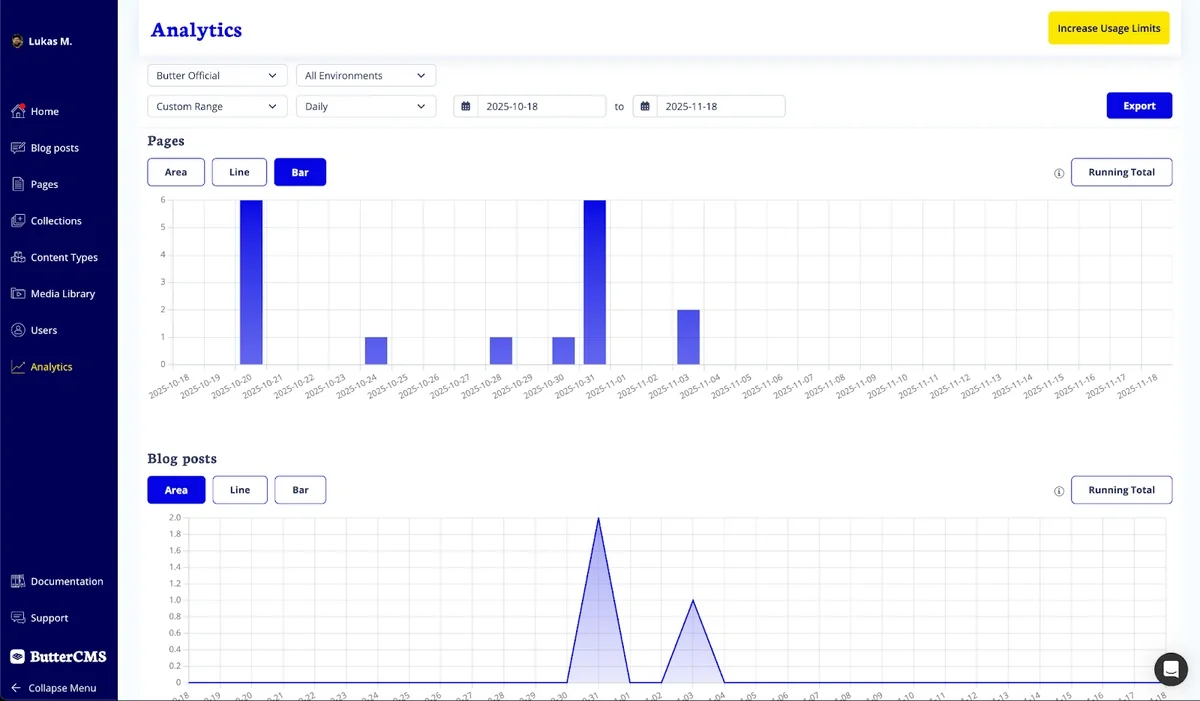
The Analytics dashboard
The dashboard includes key usage metrics:- Users - Number of users in your account
- Pages - Total pages created
- Blog Posts - Total blog posts created
- Collections - Total collections created
- Read API Requests - API calls fetching content
- Write API Requests - API calls creating, updating, or deleting content
- Line, Area, and Bar chart views
- Running Total toggle for cumulative trends
Accessing the Analytics dashboard
To access the dashboard:- Log in to ButterCMS
- Select Analytics on the navigation menu
- Your real-time charts and filters will appear immediately

Understanding your usage metrics
Read API requests
Read API requests are calls that fetch content from ButterCMS:GET /v2/posts/- Listing blog postsGET /v2/pages/{page_type}/{slug}/- Retrieving pagesGET /v2/content/- Fetching collectionsGET /v2/authors/- Listing authorsGET /v2/categories/- Listing categories
Write API requests
Write API requests create, update, or delete content:POST /v2/pages/- Creating pagesPUT/PATCH /v2/pages/{page_type}/{slug}/- Updating pagesDELETE /v2/pages/{page_type}/{slug}/- Deleting pagesPOST /v2/posts/- Creating blog postsPOST /v2/content/{collection_key}/- Creating collection items
Why monitoring matters
This quick-glance overview helps your team:- Stay within plan limits tied to your subscription
- Monitor API usage to prevent overages
- Maintain content hygiene across environments
Filtering and customizing your view
Use filters to narrow or expand exactly what you want to see:- Site - View a specific site or opt-in to view all sites
- Environments - Development, staging, and production
- Date Range:
- Month to Date
- Previous Month
- Last 12 Months
- Custom Range
- Aggregation - Daily, Weekly, Monthly, or Yearly
Exporting your data
You can export your filtered dashboard results as a CSV file for reporting or further analysis. Exports include:- Site and Environment
- All visible KPI metrics
- Data grouped by the selected aggregation (daily / weekly / monthly / yearly)
Who benefits from Analytics?
For developers and technical leads
Get instant visibility into API activity, content volume, and environment-specific usage. Quickly identify spikes, monitor deployment hygiene, and export data for system monitoring tools.For marketers and content teams
See how your content is growing over time. Track pages, posts, and collections to plan launches, support campaigns, and manage day-to-day content operations, all with simple, self-serve analytics.For partners and agencies
Review API traffic and content activity across client projects in one place, share real-time insights with clients, and ensure environments stay healthy throughout development and as they evolve.Interpreting usage patterns
Identifying normal vs. abnormal usage
Common usage patterns by integration type
Static Site Generation (SSG):- Bursts during build time
- Low usage between builds
- Spikes when webhooks trigger rebuilds
- More consistent usage throughout day
- Correlates with website traffic
- Should leverage caching to reduce calls
- Usage correlates directly with page views
- Each visitor may make API calls
- Consider edge caching or BFF pattern
Setting up usage alerts
While ButterCMS doesn’t have built-in alerting, you can set up monitoring in your application:Application-level monitoring
Integration with monitoring tools
Export your ButterCMS analytics data and integrate with:- Datadog - Custom metrics and dashboards
- New Relic - Application performance monitoring
- Grafana - Visualization of usage trends
- PagerDuty - Alerting when thresholds are exceeded
Optimizing based on usage data
High Read API usage
If you’re seeing high Read API usage, consider:- Implement caching at the application level
- Use SSG instead of SSR where possible
- Leverage webhooks to invalidate cache instead of polling
- Optimize queries with
exclude_bodyandlevelsparameters
High Write API usage
If you’re seeing high Write API usage, consider:- Batch content updates when possible
- Review automation scripts for unnecessary writes
- Audit webhook integrations that create content
- Consider using bulk operations for migrations
Usage optimization checklist
Weekly review
Weekly review
- Check current usage vs. plan limits
- Review any unexpected spikes
- Compare week-over-week trends
- Identify top API consuming features
Monthly review
Monthly review
- Export usage data for records
- Calculate average daily usage
- Project next month’s usage
- Evaluate if plan upgrade needed
Before high-traffic events
Before high-traffic events
- Review current usage headroom
- Verify caching is properly configured
- Test application under load
- Contact support if expecting unusual traffic
Environment-specific usage
Managing multi-environment usage
If you have multiple environments (development, staging, production):Development environment tips
- Use local caching to minimize API calls during development
- Consider mock data for UI development
- Only fetch from API when testing integration