Write API
Build a Content Management UI with Butter
Build your own custom content management UI dashboard and easily integrate it with a few simple javascript tools
How many different systems are you or your team having to log in to on a daily basis in order to keep your content up-to-date, show statistics that actually matter, and manage a group of content writers without losing your mind in the process?
That’s what I thought. Given there are so many options out there, companies that tend to favor integration of 3rd party, pre-made tools over the development of customized solutions suffer the risk of overwhelming their employees. Don’t get me wrong—the idea of using someone else’s product and paying for support only when you need it frees your mind from having to worry about problems with that software.
I’ve seen it over and over again—content managers (and those with similar roles) need to know how to use three or four different tools with their own unique UX designs, often unique naming conventions, and (of course) individual log-in credentials. Think about the cognitive overhead you’re adding to these people just to avoid the work that implies a custom development.
There is no integrated strategy, and as such, this can end up affecting the workflow of your company. If you’re right now in this situation, it might be a good idea to create a custom and fully integrated UI for managing your content in ButterCMS.
Building your own solution
In order to show you the power of a headless CMS such as ButterCMS, this article will show you how to create a simple UI for managing content that you can integrate into an existing platform.
What are we going to build?
For the purposes of this demo, I’m going to be building a basic custom UI that will let you handle content creation. It will list the existing articles and a basic set of stats in order to also show the dashboard-like capabilities you can potentially have.
Essentially this can be done in two screens:
- The listing screen will take care of requesting the list of articles using ButterCMS’s Read API. With this data, we’ll also do some basic calculations to present interesting stats.
- The creation screen will have a basic form where an author can enter content for a brand new post and eventually save it directly onto Butter using the Write API.
The beauty of this approach is that because Butter is a headless CMS with an API-based approach, we’ll have no need for a custom back-end running anywhere. For the purposes of this particular demo, we’ll only need to create some front-end code, and then you can take the example presented here and incorporate it into your own front-end ecosystem.
Here is the final look of our custom dashboard:
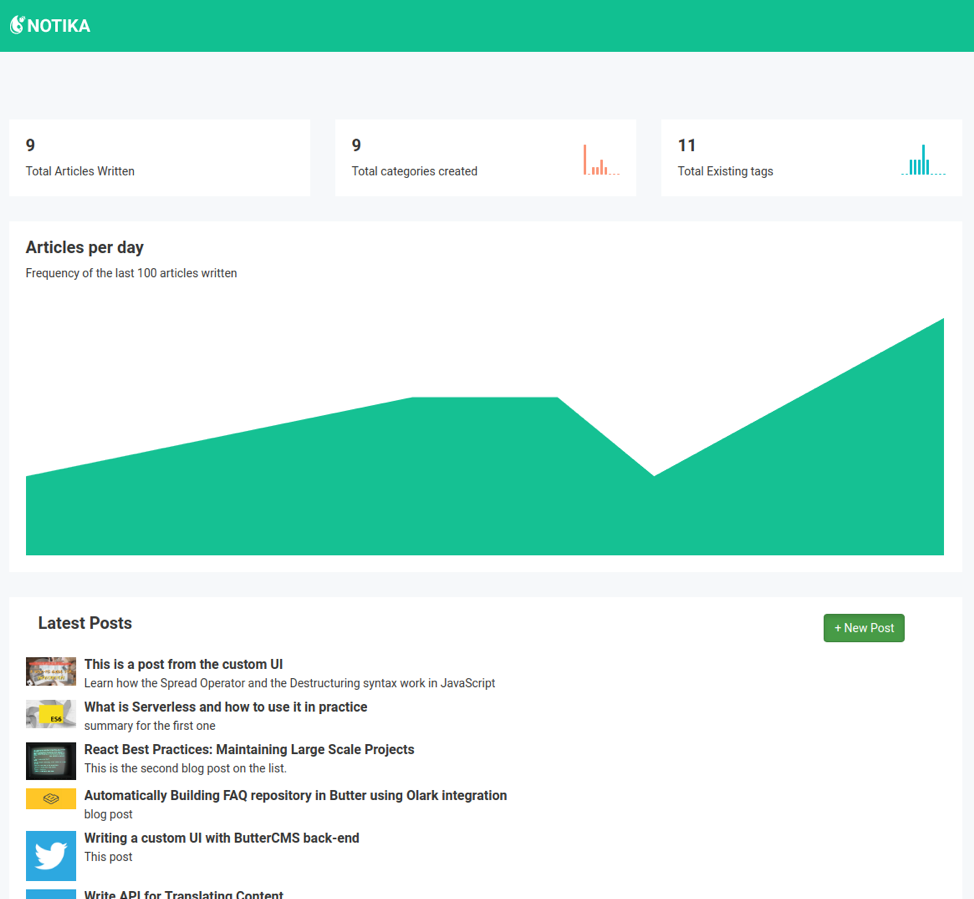
The list of articles can be seen in the bottom part of the page, while at the top we have four custom stats:
- The total number of articles written
- How many categories there are and a small histogram showing the distribution of articles per category
- Total number of tags created and another histogram showing articles per tag distribution
- Finally, a day-by-day recount of articles written (for the last 100 articles)
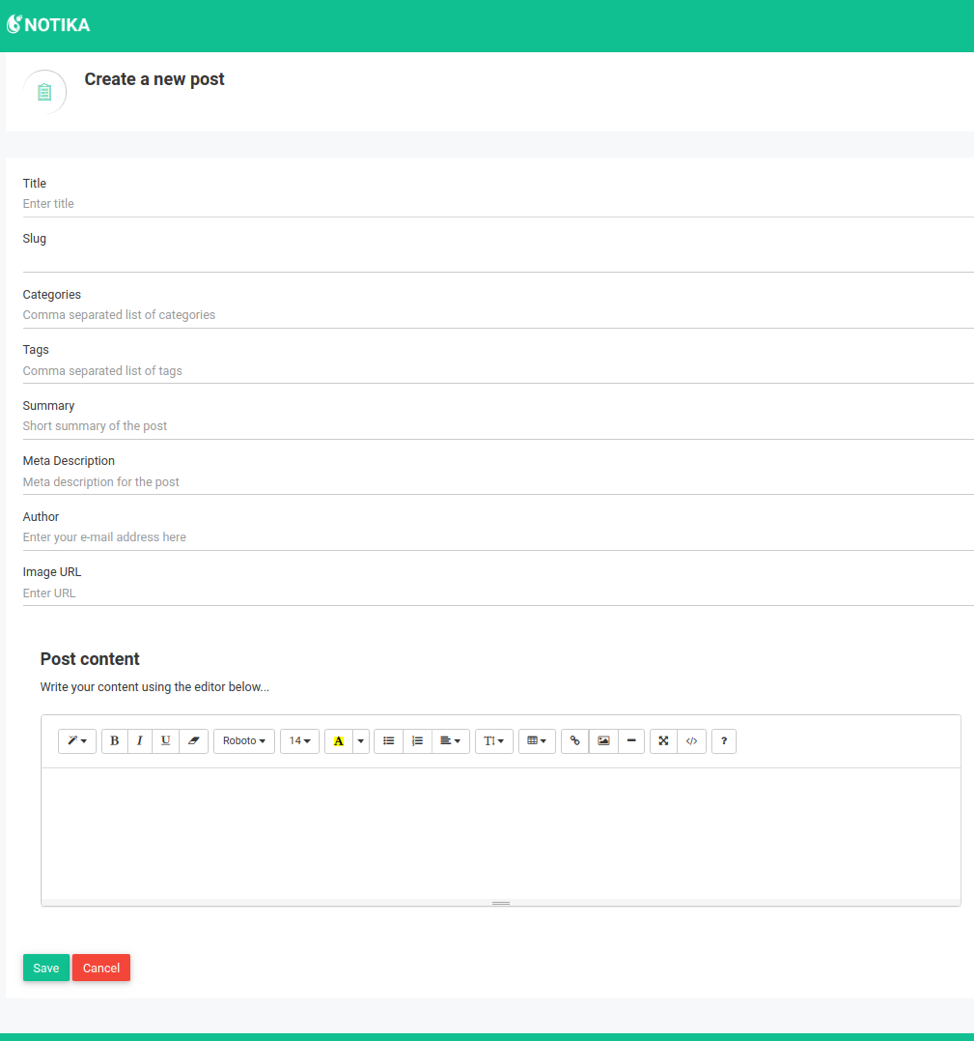
Next, the page that’ll let us create a brand new blog post is the following:
It’s a pretty straightforward UI! The fields are all manually filled, and once you hit the Save button, it’ll send the data into Butter. Let me show you how to do it.
The tools to use
To keep the code simple and easy to understand, I skipped the more complex frameworks out there such as Angular and React and went for a simple approach: jQuery.
Everything related to DOM manipulation and API interaction will be done using this library and its related plugins.
The UI you’re seeing in the above screenshots is actually taken from ThemeWagon, and you can use it too, completely for FREE.
It’s a Bootstrap and jQuery-based UI which comes already equipped with everything you need to build your own dashboard.
For the purposes of this article, I’ve taken two files, index.html and form-examples.html, and ignored the rest. If you download the theme, you’ll notice there is plenty for you to play with, but don’t get overwhelmed—just remove the parts you don’t need and use the included documentation to get the parts you actually require to work together.
Putting everything together
The main focus of the development will be on the JavaScript side, mostly due to the fact that once the JS is ready, you can integrate it with whatever HTML you have.
For the dashboard, the interaction with Butter will be done through their public library. We’ll be using their vanilla JS version, but they have bindings for other frameworks, such as Express, Angular, Vue.js, Next.js, and more. Be sure to check out their library page to see if there’s an option for your current stack.
The steps required to render the UI shown above are:
- Pull the last 100 blog posts and calculate stats based on their data
- Pull the list of the last 10 blog posts to populate the list of blog posts
- Get the list of categories for stat calculation
- Get the list of tags for stat calculation
Getting the list of blog posts
Both for steps 1 and 2, the method used will be the same. We’ll begin by including the library into our page. This can easily be done using their CDN version:
<script src="https://cdnjs.buttercms.com/buttercms-1.1.5.min.js"></script>Note how the theme is included in the Javascript files—at the bottom—to make sure everything else is ready before the code kicks in.
According to Butter’s documentation, after the JS file is included, you have access to the Butter function. This function will receive your API key (this is the Read API key) and return the ButterCMS client ready for you to use, like this:
var butter = Butter('YOUR-API-KEY');
butter.post.list({page: 1, page_size: 10, exclude_body: true})
	.then( response => {
		//your code here...
});
In that example, I’m pulling 10 blog posts in a single page without their body being included in the response. This is a way for us to save time thanks to a smaller payload being transferred. We also avoid having to deal with that information since we don’t really need it in our theme.
Now, in order to render the most recent 10 blog posts, I’m simply looping through the list, creating a new HTML element for each one using JavaScript’s template strings. (No need for a fancy template engine or anything like that.)
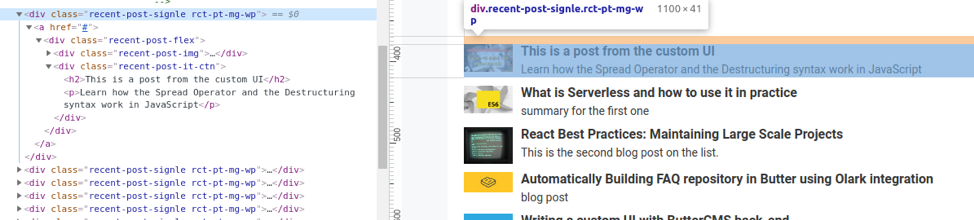
Notice how with the HTML Inspector from Google Chrome, we can see the whole HTML content that we need to reproduce in order to create new list items.
So, including that code into our callback, we can simply do this:
butter.post.list({page: 1, page_size: 10, exclude_body: true}).then(function(response) {
   let data = response.data.data;
   data.forEach( d => {
  	let $element = `<div class="recent-post-signle rct-pt-mg-wp">
  	<a href="#">
      	<div class="recent-post-flex">
          	<div class="recent-post-img">
            	<img src="${d.featured_image}" alt="">
          	</div>
          	<div class="recent-post-it-ctn">
              	<h2>${d.title}</h2>
              	<p>${d.meta_description}</p>
          	</div>
      	</div>
  	</a>
  	</div>`
  	$("#latest-posts").append($element)
  })
});
Notice how we’re simply looping through the list of blog posts and appending new elements into a container element. jQuery (which is assigned to the $ variable) will take care of transforming our string into an actual DOM element, so we don’t have to worry about that part.
Pulling the data for the statistics widgets works in the same way but with a bit more code:
butter.post.list({page: 1, page_size:100, exclude_body: true}).then( response => {
  let posts = response.data.data;
  //Counters
  let countsByDay = new Map();
  let countsByTag = new Map();
  let countsByCat = new Map();
  //Show the number of articles
  $("#total-articles .counter").text(posts.length);
  $('#total-articles .counter').counterUp({
	delay: 10,
	time: 1000
  });
  posts.forEach( p => {
	//key for main chart
	let key = p.published.split("T")[0];
	key = +([...key].filter( c => c != "-").join(""));
	if(isNaN(countsByDay.get(key))) {
  	countsByDay.set(key, 0);
	}
	countsByDay.set(key, countsByDay.get(key) + 1);
	p.categories.forEach( c => {
  	let k = c.slug;
  	if(isNaN(countsByCat.get(k))) {
    	countsByCat.set(k, 0);
  	}
  	countsByCat.set(k, countsByCat.get(k) + 1);
	});
	p.tags.forEach( t => {
  	let key = t.slug;
  	if(isNaN(countsByTag.get(key))) {
    	countsByTag.set(key, 0);
  	}
  	countsByTag.set(key, countsByTag.get(key) + 1);
	});
  });
  showHistograms(countsByCat, countsByTag);
  renderMainChart(countsByDay);
});
A couple of highlights from the above code:
- We’re keeping count of total articles, articles by category, and articles by tag using JavaScript Maps. This lets us quickly categorize our counters and keep two-dimensional arrays that make more sense semantically.
- The main chart’s X-axis will be the date of publication for each post. But since the library we’re using (one that already comes with our theme, called Flot) requires all values to be numbers, I did a quick translation of the string we’re getting (which has a YYY-MM-DDTHH:mm:SS format) into a single number that can easily be sorted without having to understand dates. Notice that this translation is done with a one-liner, thanks to ES6’s new spread operator: (
[...key].filter( c => c != "-").join("")). With that line, we’re turning the string into a list of characters, filtering to remove “-” characters, and finally joining them back together and turning them into a number. - Histograms and the main chart are rendered after every blog post has been reviewed.
The histogram function is simply a call to one of Flot’s many methods:
function showHistograms(countsByCat, countsByTag) {
  //Show histogram of posts by category
  $("#total-cats-bars").text([...(countsByCat.values())].join(","));
  //Show histogram of posts by tags
  $("#total-tags-bars").text([...(countsByTag.values())].join(","));
  //render histograms
  if($('.sparkline-bar-stats2')[0]) {
	$('.sparkline-bar-stats2').sparkline('html', {
    	type: 'bar',
    	height: 36,
    	barWidth: 3,
    	barColor: '#fb9678',
    	barSpacing: 2
	});
  }
  if($('.sparkline-bar-stats3')[0]) {
	$('.sparkline-bar-stats3').sparkline('html', {
    	type: 'bar',
    	height: 36,
    	barWidth: 3,
    	barColor: '#01c0c8',
    	barSpacing: 2
	});
  }
}
Again, thanks to the spread operator, we’re just turning the iterator object (returned by the values method) into a simple array. Then, we’re turning that into a comma-separated string, which is what our plotting library needs.
The final method used to render the main chart doesn’t have a lot of special code other than parsing the X-axis during the hover event in order to show the tooltip:
function renderMainChart(countsByDay) {
  //Render main chart
  let [...d3] = countsByDay.entries();
  var options = {
	series: {
  	  shadowSize: 0,
  	    curvedLines: {
    	      apply: !0,
    	      active: !0,
    	      monotonicFit: !0
  	    },
  	    lines: {
     	      show: !1,
    	      lineWidth: 0,
    	      fill: 1
  	    }
	},
	grid: {
  	  borderWidth: 0,
  	  labelMargin: 10,
  	  hoverable: !0,
  	  clickable: !0,
  	  mouseActiveRadius: 6
	},
	xaxis: {
  	  tickDecimals: 0,
  	  ticks: !1
	},
	yaxis: {
  	  tickDecimals: 0,
  	  ticks: !1
	},
	legend: {
    	  show: !1
	}
  };
  $("#curved-line-chart")[0] && $.plot($("#curved-line-chart"), [ {
  	data: d3,
  	lines: {
       show: !0,
       fill: .98
  	},
  	label: "Articles",
  	stack: !0,
  	color: "#00c292"
  }], options), $(".flot-chart")[0] && ($(".flot-chart")
	.bind("plothover", function(event, pos, item) {
  	if (item) {
    	let label = item.datapoint[0];
    	//parse index and get the date
    	[, year, month, day] = /([0-9]{4})([0-9]{2})([0-9]{2})/.exec(label);
    	let x = `${month}/${day}/${year}`,
        	y = item.datapoint[1];
    	$(".flot-tooltip").html(item.series.label + " for " + x + " : " + y).css({
        	top: item.pageY + 5,
        	left: item.pageX + 5
    	}).show()
  	} else $(".flot-tooltip").hide()
  }), $("<div class='flot-tooltip' class='chart-tooltip'></div>").appendTo("body"));
}
Notice at the last part of the code that we’re using a regular expression to parse our X-axis (which we manually created before) and get back a viable date string:
[, year, month, day] = /([0-9]{4})([0-9]{2})([0-9]{2})/.exec(label)That’s the destructuring syntax from ES6, allowing us to ignore the first element of the match array returned by the exec method, and at the same time individually assign the rest of the items into different variables.
This code allows us to show the following tooltip without having to maintain extra information associated with the values on the X-axis.

Saving the blog posts
Now, saving the new blog posts into ButterCMS (our de facto back-end) is quite simple. However, because this will require us to interact with the Write API, we’ll have to manually perform the required POST operation.
Thanks to jQuery, performing this action once the user clicks on the Save button is actually very easy to do.
Let me show you the code first:
$("#save-btn").on('click', evnt => {
  let payload = {
	author: {
  	  email: "deleteman@gmail.com"
	},
	categories: $("#post-cats").val().split(","),
	tags: $("#post-tags").val().split(","),
	featured_image: $("#post-image").val(),
	slug: $("#post-slug").val(),
	title: $("#post-title").val(),
	body: $(".panel-body").html(),
	summary: $("#post-summary").val(),
	seo_title: $("#post-title").val(),
	meta_description: $("#post-meta").val(),
	status: "published"
  };
  $.post({
	url: "https://api.buttercms.com/v2/posts/",
	data: payload,
	dataType: 'json',
	headers: {
  	  "Authorization": "Token YOUR-WRITE-KEY"
	},
	success: function(resp) {
  	  if(resp.status == "pending") {
    	    $("#success-alert").removeClass("hidden")
    	    setTimeout( _=> {
        	window.location.href = "index.html"
    	    }, 3000)
  	  }
	  }
    });
  return false;
});
With the above code, we’re simply configuring a callback function to be used when the user clicks on the button. Once that happens, we’ll collect the data directly from the individual elements and then simply perform the POST request.
In order to create a new blog post using Butter’s Write API, you need to perform a POST request to https://api.buttercms.com/v2/posts/, making sure you add the authorization token you were given with your corp plan.
Notice that if everything goes according to plan, you’ll get a “status pending” response since blog posts aren’t created immediately. A few minutes later (in some cases a bit less), the new post should appear on your custom list from before.
Conclusion
With the above code snippet, I was able to create a quick, custom dashboard that is not only capable of showing relevant information but also doesn’t really require any type of infrastructure to use.
With the above, you can simply open the files on your local computer using your favorite browser. Even better, if you already have a custom content management platform, integrating this should not pose too much of a problem, since it’s just a bit of HTML, CSS, and some quick and dirty JavaScript calls.
Have you had a similar experience benefiting from a headless CMS such as Butter? Share it down in the comments!